Enjoy this content?
Click to make it sunny!
Introduction
While most of us just see weather radar as colorful blobs moving across our screens, this sophisticated technology is a critical tool for tracking and predicting dangerous weather events and their potential hazards and paths. Understanding how to read radar signatures is an essential skill for anyone interested in severe weather awareness.
Note from the author:
The content of this page is intended for educational purposes. While nearly all of the content comes directly from reputable sources (radar manufacturer manual, National Weather Service, my own collaboration with radar operators, etc), you should use this information at your own risk. Always have trustworthy & reliable sources for your weather alerts.
-Eric
Across the world, radar is used for many different purposes: military, traffic control, and weather. Specific to weather, radar play a critical role in severe weather alerting.
Let’s explore some foundational topics related to weather radar.
Weather Radar
It’s believed the U.S. Navy coined the term “RADAR”, a shorter version of the name for the technology they used detecting/measuring distance of enemy ships/planes.
RAdio Detection And Ranging -> RADAR
Radar Terms
Here is a list of basic radar terms:
- Doppler - type of radar used for monitoring weather
- Beam - the signal of the radar, similar to light from a flashlight
- Tilt - the angle of elevation the radar is sending/receiving it’s signals at. Each rotation of the radar scans at a specific tilt
- Echo - the reflected signal back to the radar. The characteristics of the Echo determines the size/shape/density/movement of the object
Radar Behavior
The radar rotates 360°, just like the light in a lighthouse. Every fraction of a second, the radar sends out a radio wave signal and waits for any responses.
If nothing is encountered, let’s say ‘clear skies’, no signal will be returned to the radar.
If the radar signal encounters an object, the radio waves bounce off of the object and scatter in several directions. A portion of the original signal is reflected back to the radar and calculations are made about the type of object it encountered. Essentially, a radar “hears” the reflected signal, this is why a response signal is affectionately referred to as an “Echo”.
Radar Base Products
Echo (response) data is constantly analyzed and then published for our use via several “products” - which make it easier for us to visually interpret.
As we explore more about these base radar products, we’ll use both conceptual as well as actual radar images, plus example photographs from a storm chase in 2024 across Iowa.
Storm Chase
- Date/Time : June 22, 2024 5:34pm
- Location : just north of Aurora, IA
- Radar : apprx 85mi SW from KARX (LaCrosse, WI)
- Beam Height At Storm : Tilt1- 7.1k ft … Tilt2 - 13.6kft
Reflectivity
As it rotates, at a single elevation (tilt), the radar is constantly sending/receiving signals. Radar analyzes the response data to determine the density and distance of objects the beam has encountered. This helps us determine the density and distance of water droplets in the air - e.g. rain, hail, etc.
Air itself cannot be seen by radar, only the objects in the air which reflect the radio waves. These objects could be moisture, precipitation, debris, or even insects or airplanes.
Reflectivity Products
There are two types of Base Reflectivity products:
- Base Reflectivity: reflectivity data scanned at a single tilt
- Composite Reflectivity: highest reflectivity merged from all tilts
Both of these products provide valuable information, but each come with trade-offs as well. More about this in Advanced Radar Topics .
Understanding Reflectivity
The strength of the Echo and delay it takes to receive the response calculate into the density and location of moisture in the air and the distance away from the radar.
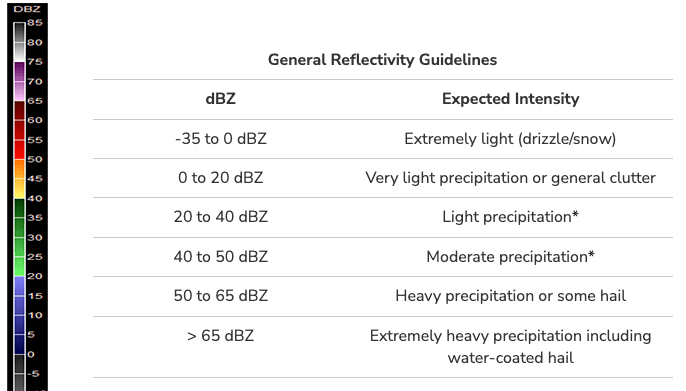
The table below shows examples of common precipitation types with their corresponding reflectivity dBZ values.
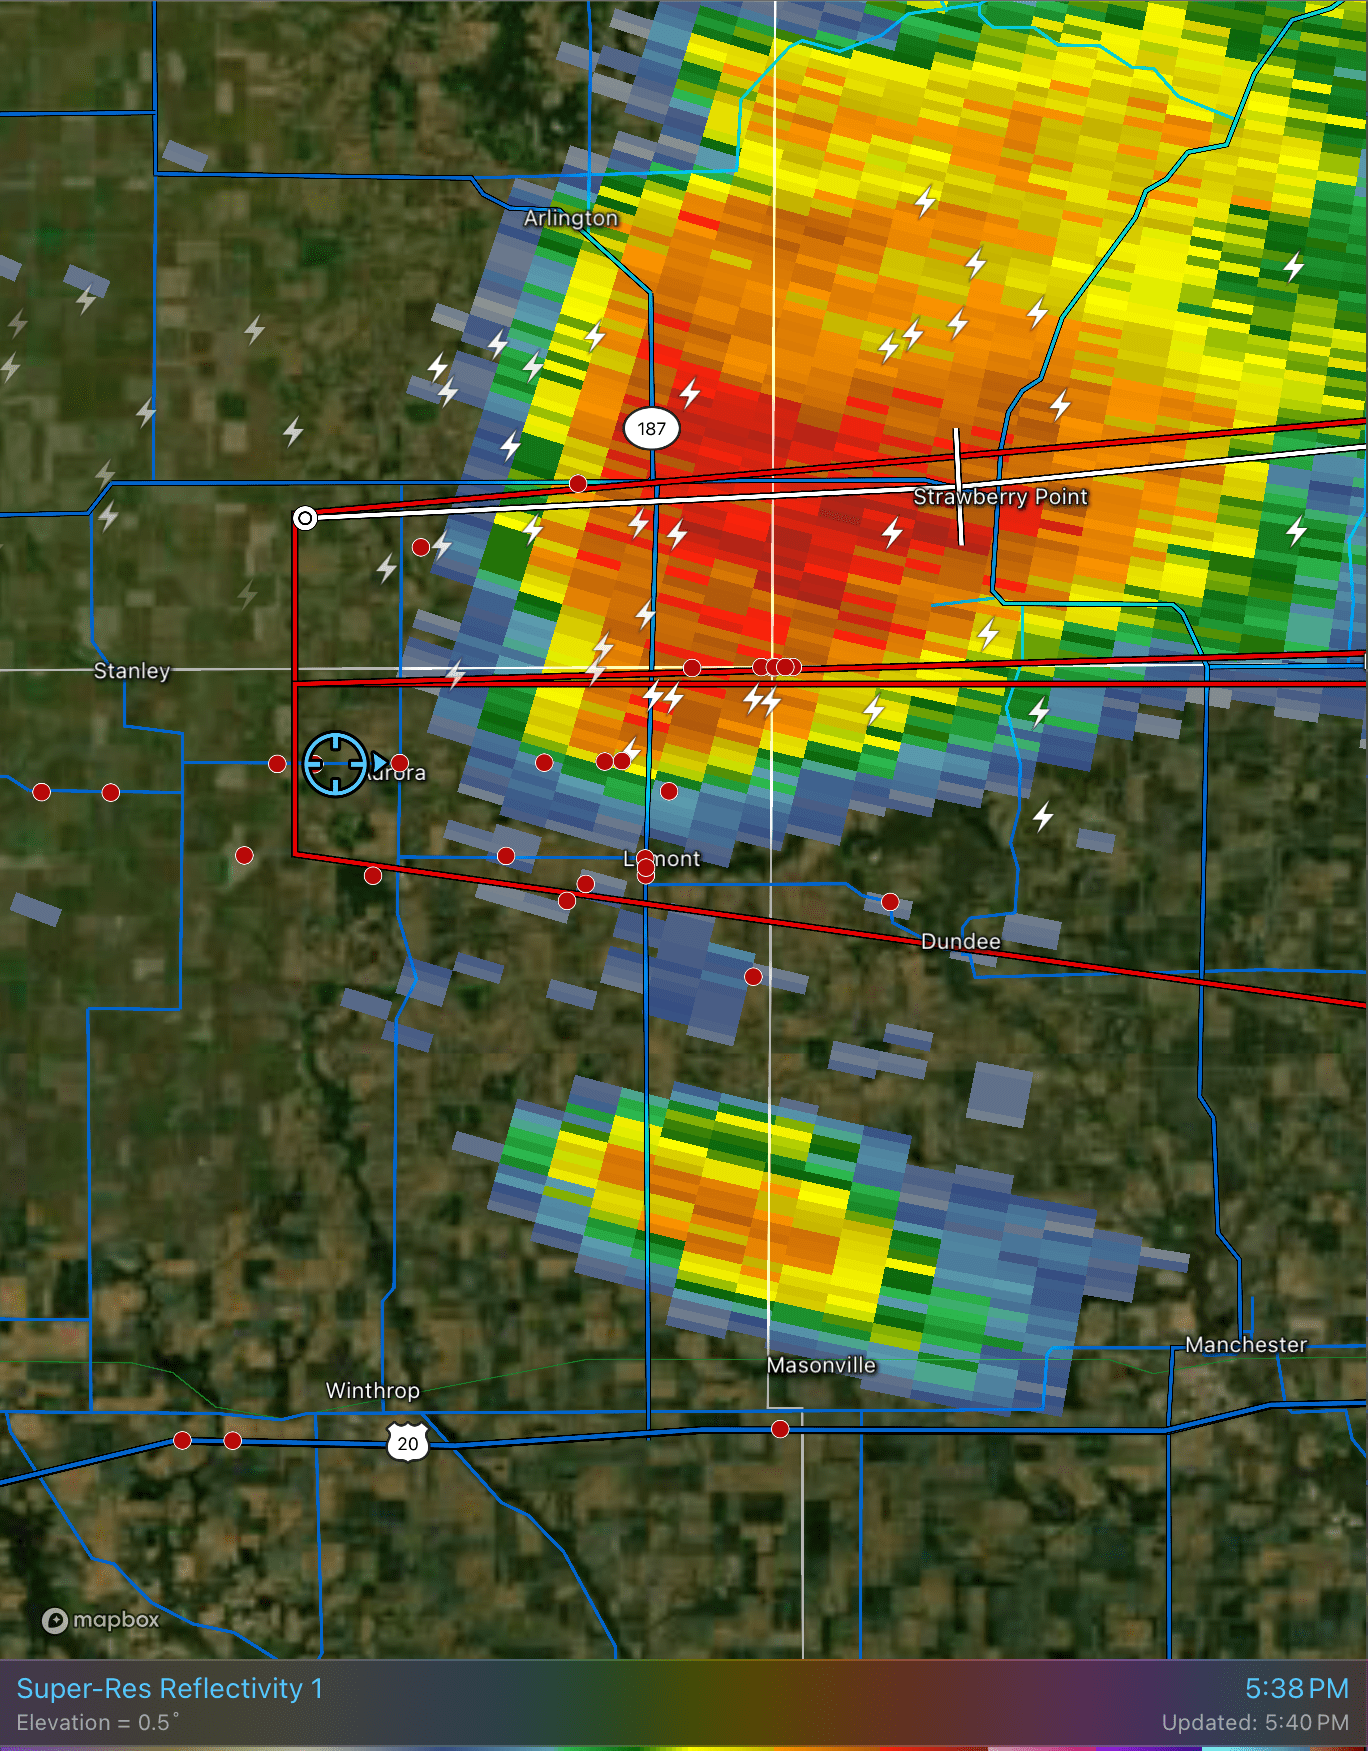
Now, let’s take a look at the actual Reflectivity image from the storm chase. The light blue circle with cross-hairs is my current position.
Notice the areas with mostly red pixels. These are areas with the heaviest concentration of moisture (rain). Notice how these areas are somewhat in the center of the storm.
Next, take a look at the areas to the left and right of the dense rain. To the left, the cutoff of rainfall is abrupt.
Moving to the right, the storm takes on a “V” or ♥ like shape, widening to the north east. This is a common structure for storms in the northern hemisphere caused by stronger, upper-level winds blowing moist air out and away from the core of the storm (in the lower left).
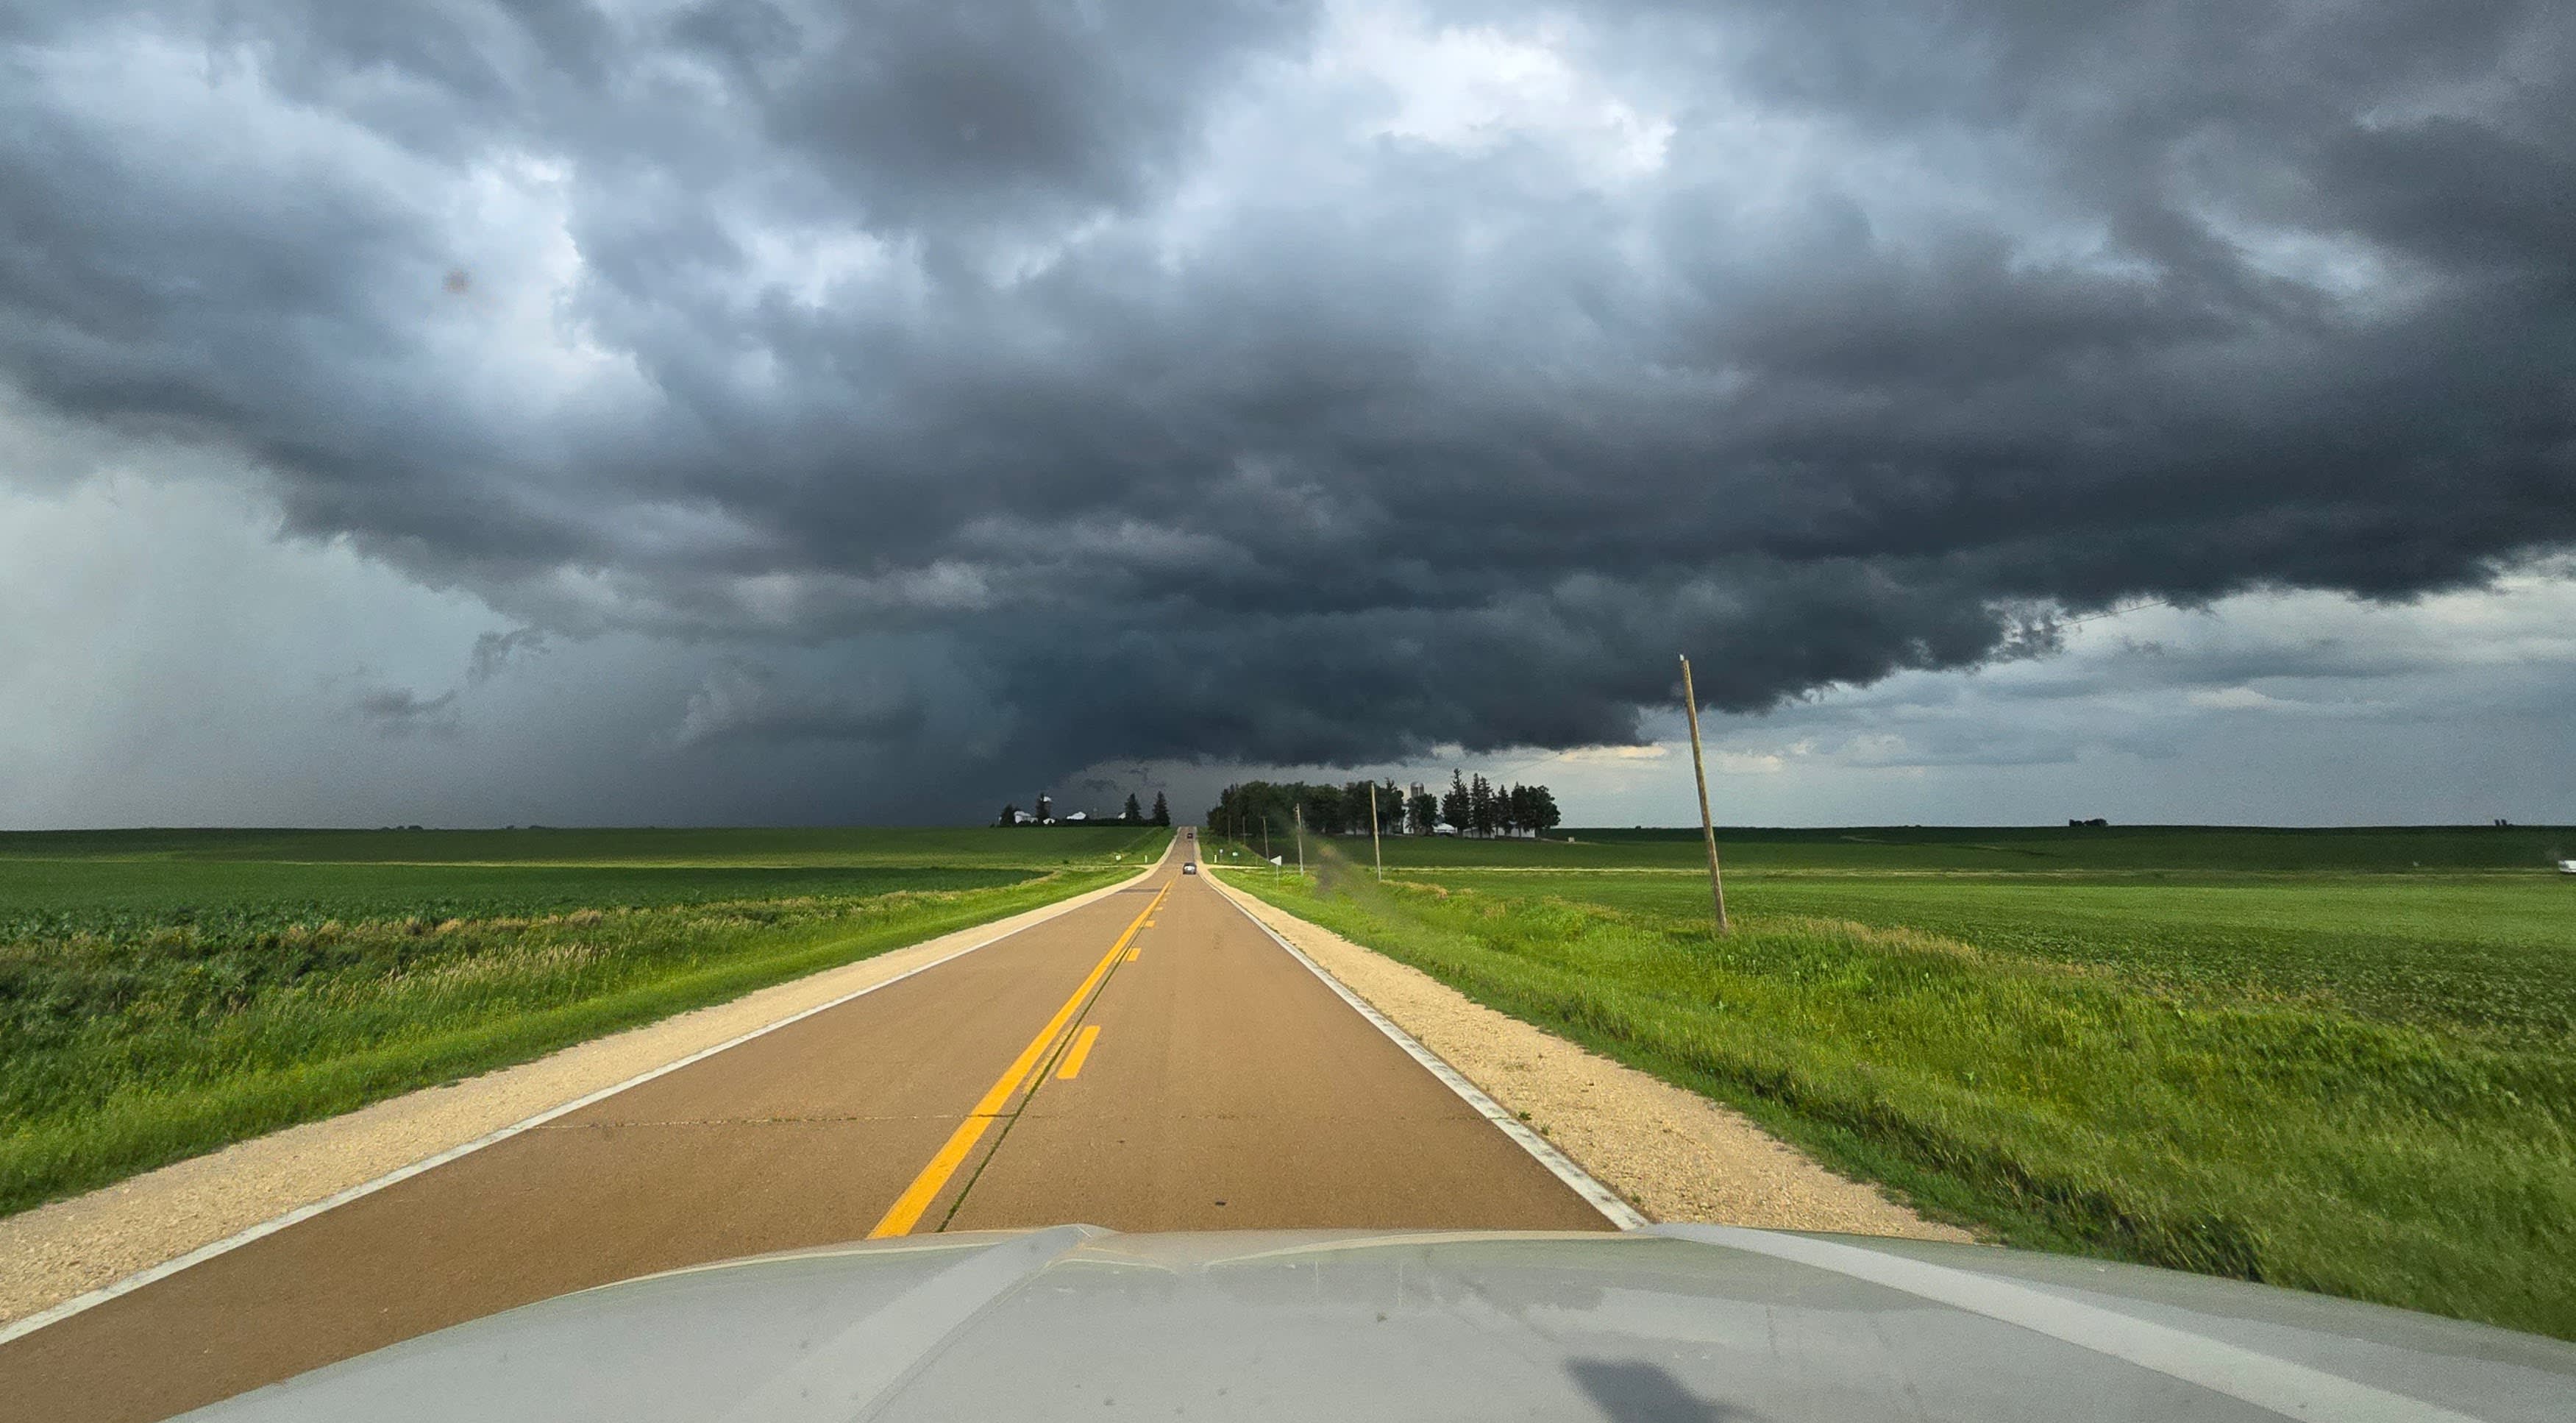
For reference, here is a visual of the storm - from behind, looking east. The core rain shaft can be seen off to the left.
Reflectivity Considerations
The beam from the radar expands and increases in height. This has several trade-offs in benefits, discussed in more detail on the Advanced Radar Topics page.
Weather radar can see things other than rain too.
Birds, insects, and even airplanes are all detected by the radar. These objects don’t typically cause challenges during severe weather, but can often create confusion with images seen during otherwise calm conditions.
Velocity
In addition to detecting the type/size of objects, radar can also detect motion of these objects.
Velocity Products
There are two main types of Velocity products:
- Base Velocity
- Storm Relative Velocity
Base Velocity is best used for seeing the overall motion of wind at different levels (tilts). It is also helpful for seeing anomalies to the overall wind pattern, such as microbursts (aka downbursts or “straight line winds”).
Storm Relative Velocity subtracts the average wind values to show what’s happening to wind within storm as it moves along. This can be especially helpful in seeing rotation, when strong winds could otherwise mask those values.
Understanding Velocity
Velocity describes both speed and direction of an object. Unlike a straightforward compass reading, understanding the nuances of radar data takes a bit more knowledge (and practice).
Radial Velocity
There is an important limitation to consider when looking at velocity images:
Doppler radar can only calculate motion moving directly towards or away from the radar.
This means any wind moving at an angle relative to the radar’s beam will measure as only a portion of the actual wind speed. This portion of the actual wind is called the Radial Velocity (i.e. the portion of wind moving along the radial).
Radial is the technical term for the radar beam. You could think of just like the rotating light beam of a lighthouse.
Radial Velocity is discussed in more detail on the Advanced Radar Topics page.
Interpreting Velocity
In the US, we typically use miles per hour (mph) as a measure of speed, and labels like north, south, west, east for direction.
Weather radar typically uses mph or knots (kts) as a measurement for speed. Knots are very close to miles per hour.
Rather than use directions like north or south, weather radar typically uses colors to visualize winds moving towards or away from the radar.
Consider the conceptualized velocity image below, assuming the radar site is at the center and north is up.
- green values on the left (wind moving towards the radar)
- red values on the right (wind moving away from the radar)
We can easily infer a consistent wind pattern ->, broadly moving west to east .
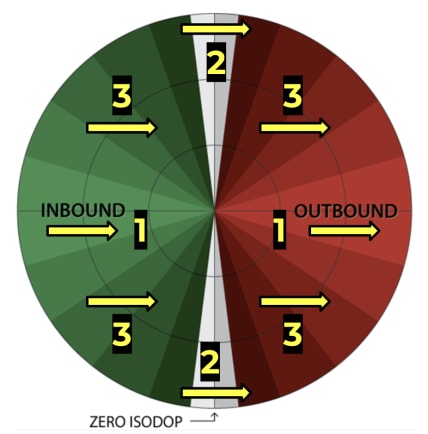
On Velocity images, brightness of the colors often indicate the strength of the wind.
Referring to the image above, it would appear that our strongest winds (bright green and red), are located near the center of the image. It would also appear that winds decrease in velocity as you move away from center.
However this would be a poor interpretation. The radar only shows us the Radial Velocity “portion” of the actual wind. The radial velocity is decreasing due to the angle of the wind to the radial beam, but the actual wind speed is likely the same over this whole area!
It is critical - you must know where the radar’s location is to interpret (estimate) actual wind speed at a location!
We can see the Radial Velocity continues to decrease until the wind reaches an angle perpendicular to the radial (beam). This area in gray is called the “Zero Isodop” and is where winds (still traveling the same direction and likely same speed) will register as 0!
Even strong winds moving perpendicular to the radial (radar beam), will register near 0. They often showing up very dark or grayish in color (depending on your radar).
Velocity in Action
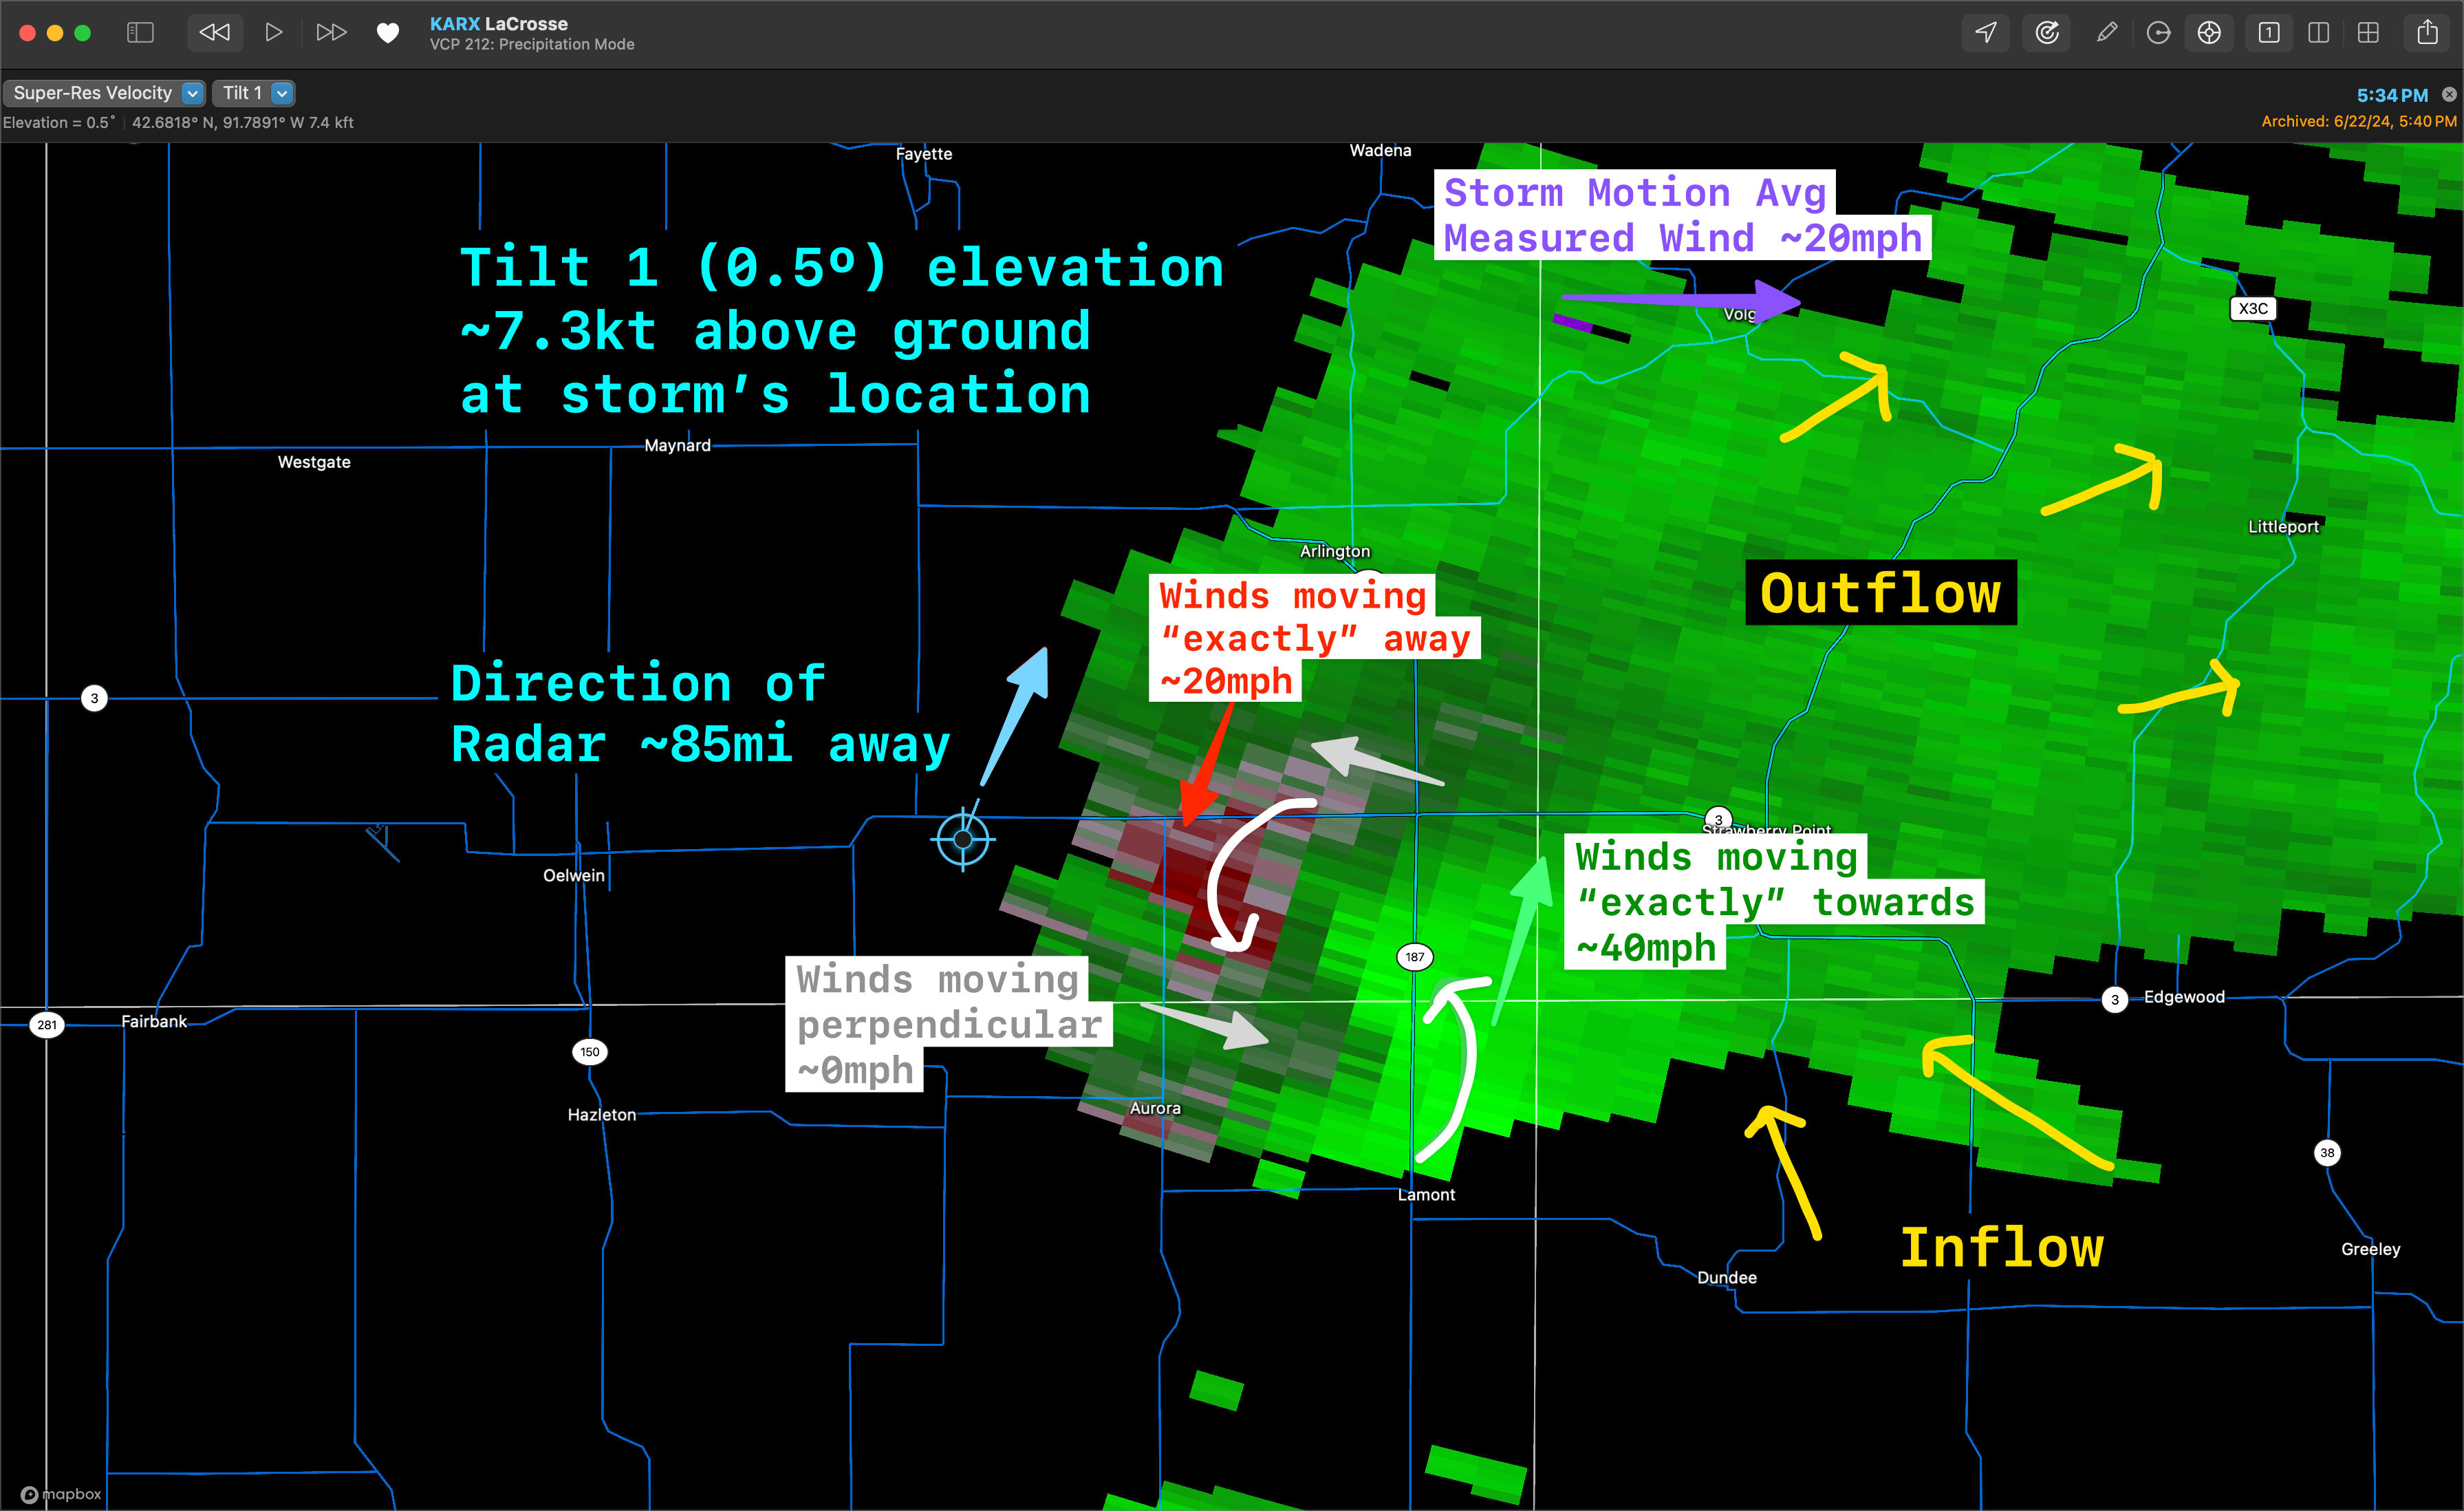
Now, take a look at the velocity scan (pulled from the archive) during our storm chase.
FIRST! - Note the location of the radar (off screen towards the upper right).
You can see the bright green areas show the “strongest” measured winds moving along the radial, towards the radar. Also apparent are, bright red areas of the image where winds are measured the strongest moving along the radial, away from the radar.
Remember, these aren’t necessarily THE strongest winds, just what the radar measures highest because they are moving directly towards/away from the radar.
This is also confirmed by the gray arrows which point perpendicular to the radar beam.
Combing these arrows we can clearly see tight rotation within the storm. This signature is marking a mesocyclone, and supports the tornado warnings seen in the Reflectivity image.
Also note the yellow arrows. The green band extending from the lower right of the storm is air moving into the storm and marks the storm’s inflow. Above that, broad area of expanded moisture denotes the storm’s outflow (and
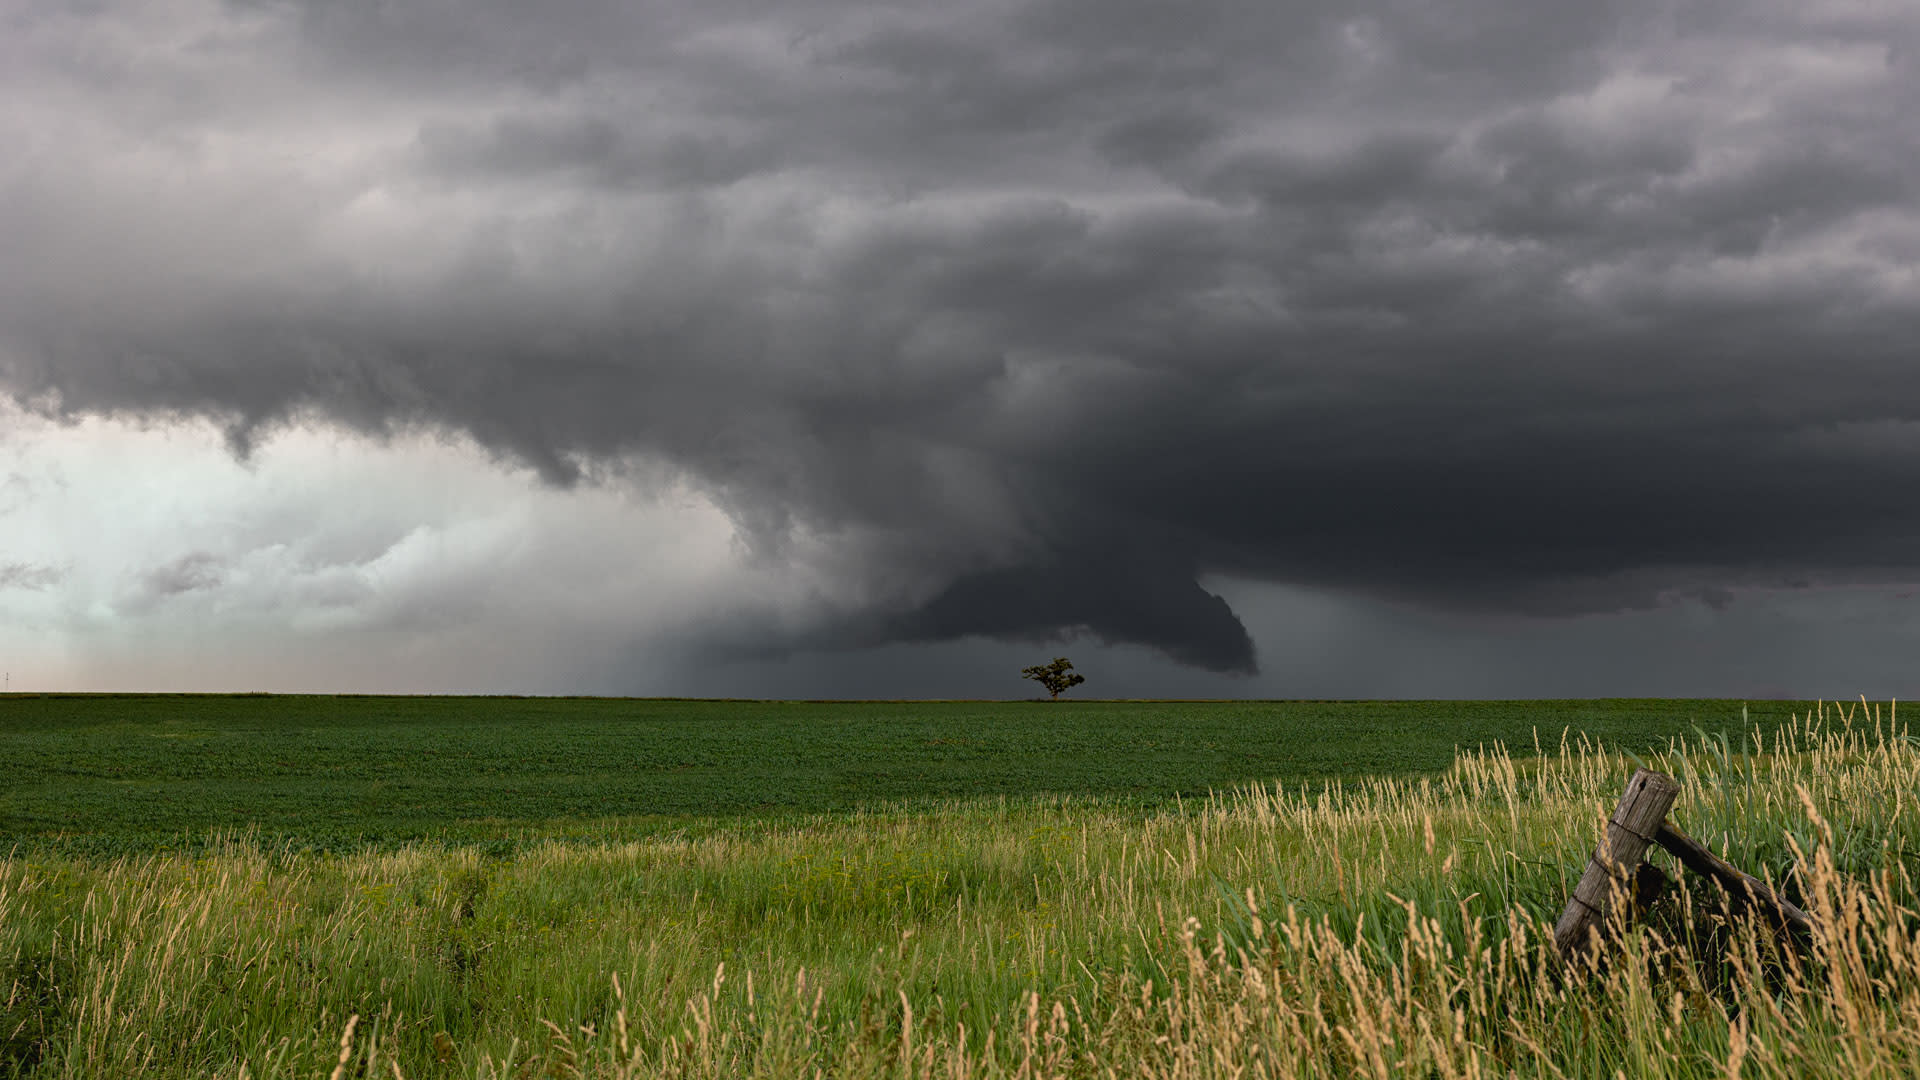
For reference, here is another picture of the actual storm in our chase, this time a view looking towards the north.
Notice the rain-free area to the left. This is the typically the area of strongest updraft, which prevents any precipitation from falling.
The dark wall cloud, with a classic inflow tail, matches up perfectly to the Velocity image above.
Spectrum Width
Spectrum Width is a valuable, but often over-looked product from the radar.
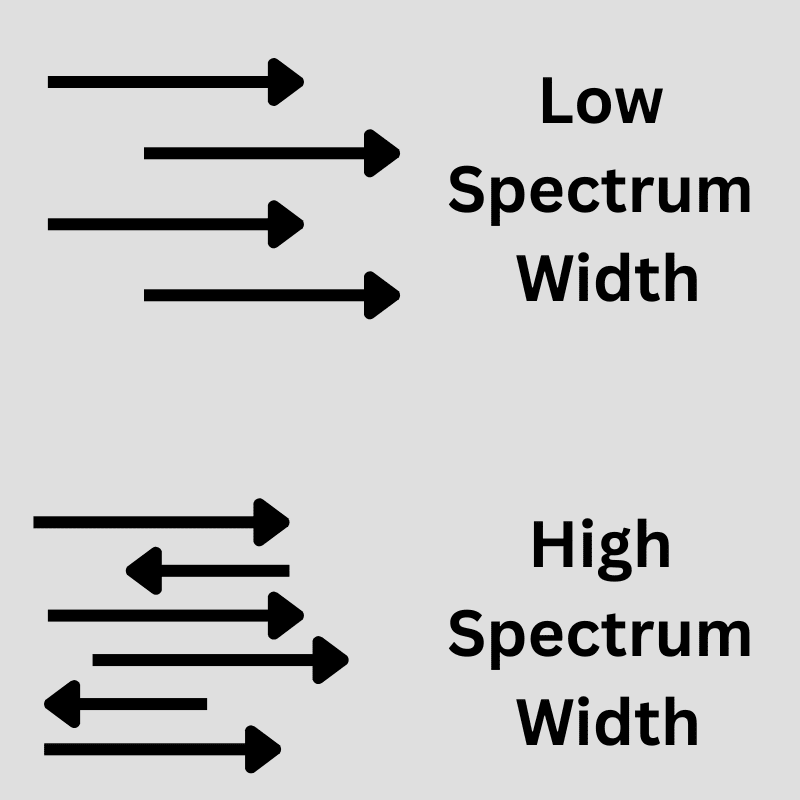
Spectrum Width measures the turbulence of the environment. Or said another way, how consistent (or not) the velocity values are to one another.
Some of the best uses for Spectrum Width are simply validating things we hypothesize in other two products e.g. Reflectivity and Velocity.
For example, the leading edge of a fast moving storm may produce damaging winds. But, the location of that edge may be difficult to determine using Reflectivity or Velocity alone. Additionally, rotation may sometimes be difficult to see depending on the speed of the storm and location of the storm relative to the radar.
Adding Spectrum Width, we can see where most of the turbulence is occurring and draw some more defined lines.
Spectrum Width in Action
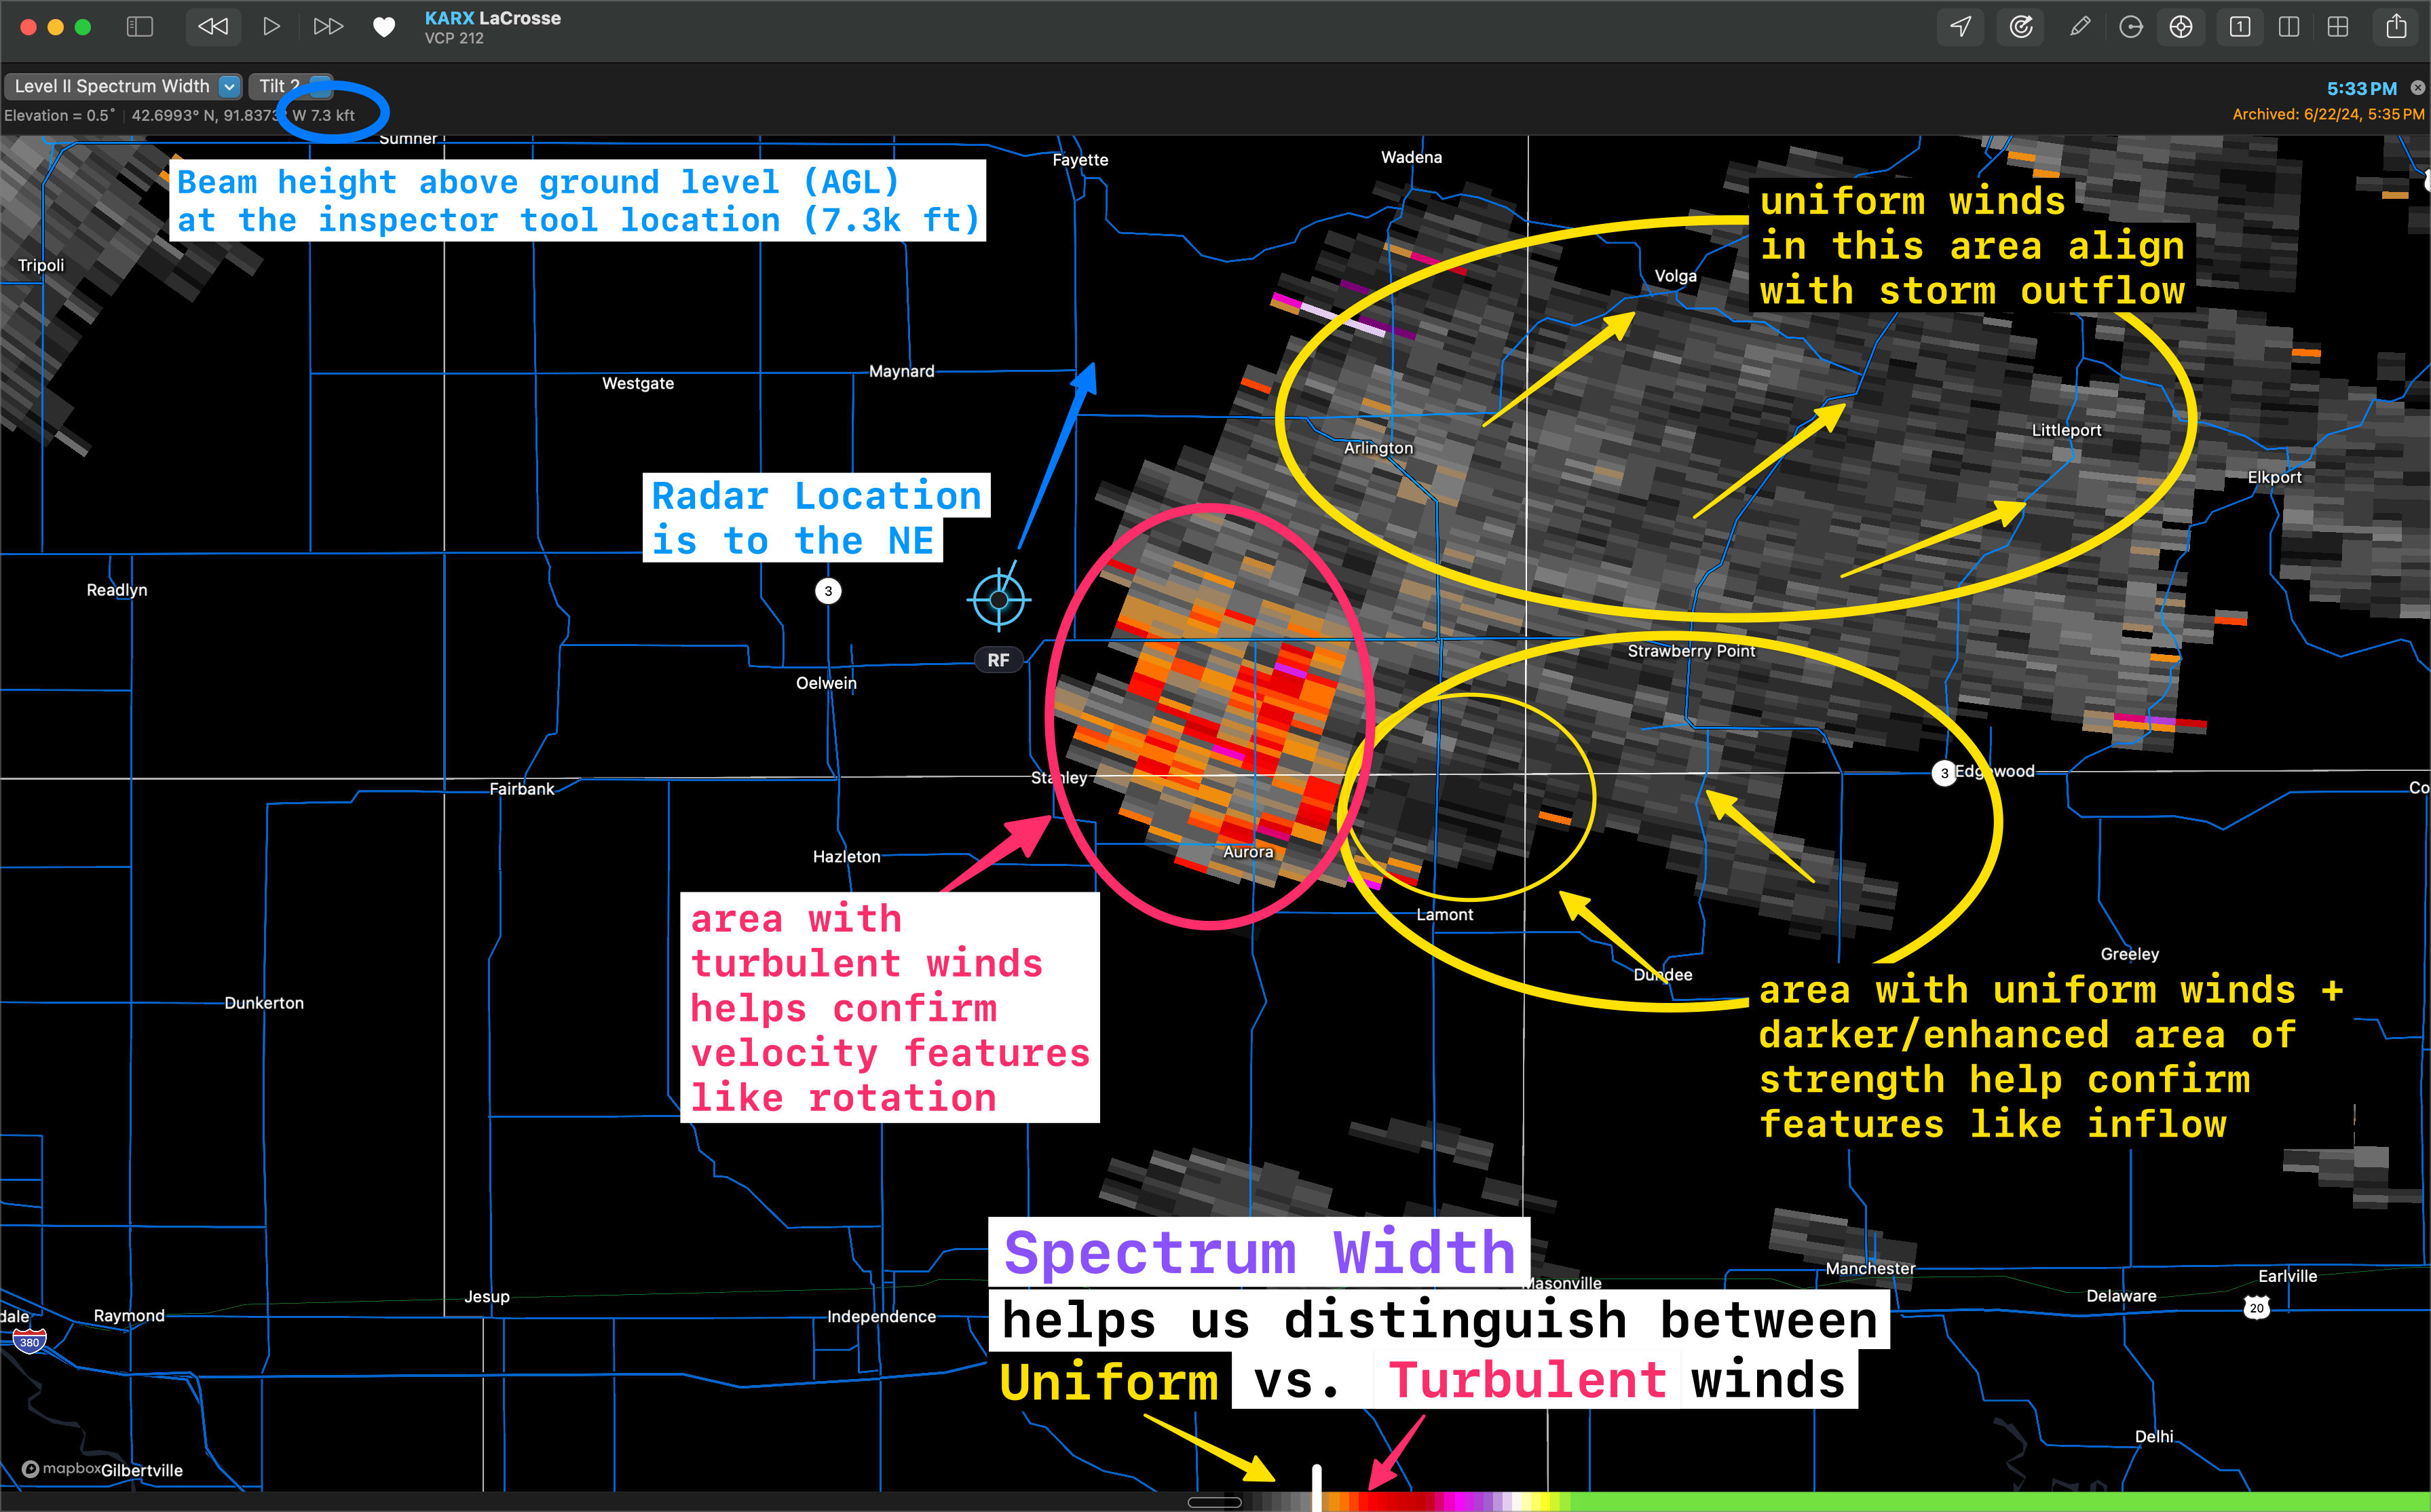
Look at the Spectrum Width scan below.
Remember that:
- areas of high spectrum width (bright orange here) = high turbulence
- areas of low spectrum width (gray colors) = low turbulence, uniform winds
From the Spectrum Width product, we can see:
- large area of uniform wind (yellow circles) - which validates where we were hypothesizing the storm’s inflow/outflow
- large area of turbulence (white circle with orange/red pixels) which sits smack dab over the area of rotation we noted
Weather Radar Apps
The information provided by most weather radars is available for 'free' .
There are a number of apps and websites that provide this information at no cost, starting with the National Weather Service .
Other free websites & apps provide forecast data and basic radar information. Here are a few:
There are a number of free/paid apps that focus only on radar. If you are interested in severe weather awareness, I highly recommend checking one of them out.
RadarScope is my pick and likely my #1 overall must have app for weather awareness and storm chasing.
I’m planning some additional content specific to RadarScope, so stay tuned for that in the future.
Summary
Resources
NWS WSR-88D - Additional info on WSR-88D Radar used by NWS.
NWS Radar Operations Center - mission, history, other interesting info