Enjoy this content?
Click to make it sunny!
Introduction
From Base Reflectivity and Spectrum Width to Differential Reflectivity, we'll discuss techniques to properly interpret radar images.
Note from the author:
The content of this page is intended for educational purposes. While nearly all of the content comes directly from reputable sources (radar manufacturer manual, National Weather Service, my own collaboration with radar operators, etc), you should use this information at your own risk. Always have trustworthy & reliable sources for your weather alerts.
-Eric
Basic Interpretation Tips
For those new to advanced radar products:
- Start with reflectivity : Understand basic reflectivity precipitation patterns before diving into specialized products
- Analyze multiple layers : Become comfortable with how radar images change with height
- Learn velocity basics : Look for areas where colors change abruptly from red to green (or vice versa), indicating shear or rotation
- Understand your limitations : Some products require significant training to interpret correctly
- Compare products : Looking at multiple products together often provides better insight than any single product alone
Base Products
Here we’ll dive deeper into the base products of weather radar.
Reflectivity
There are two types of Reflectivity base products:
Base Reflectivity (Z) - reflectivity at a single elevation
This is is helpful for understanding where precipitation may exist in the atmosphere. Is rain primarily low to the ground? Is it elevated? Which part of the storm is the strongest?
Composite Reflectivity - blend of max reflectivity from each elevation in the volume scan
Composite Reflectivity is helpful for seeing overall intensity of a storm and how it is trending.
Below are two screenshots of Reflectivity (left) and Composite Reflectivity (right).
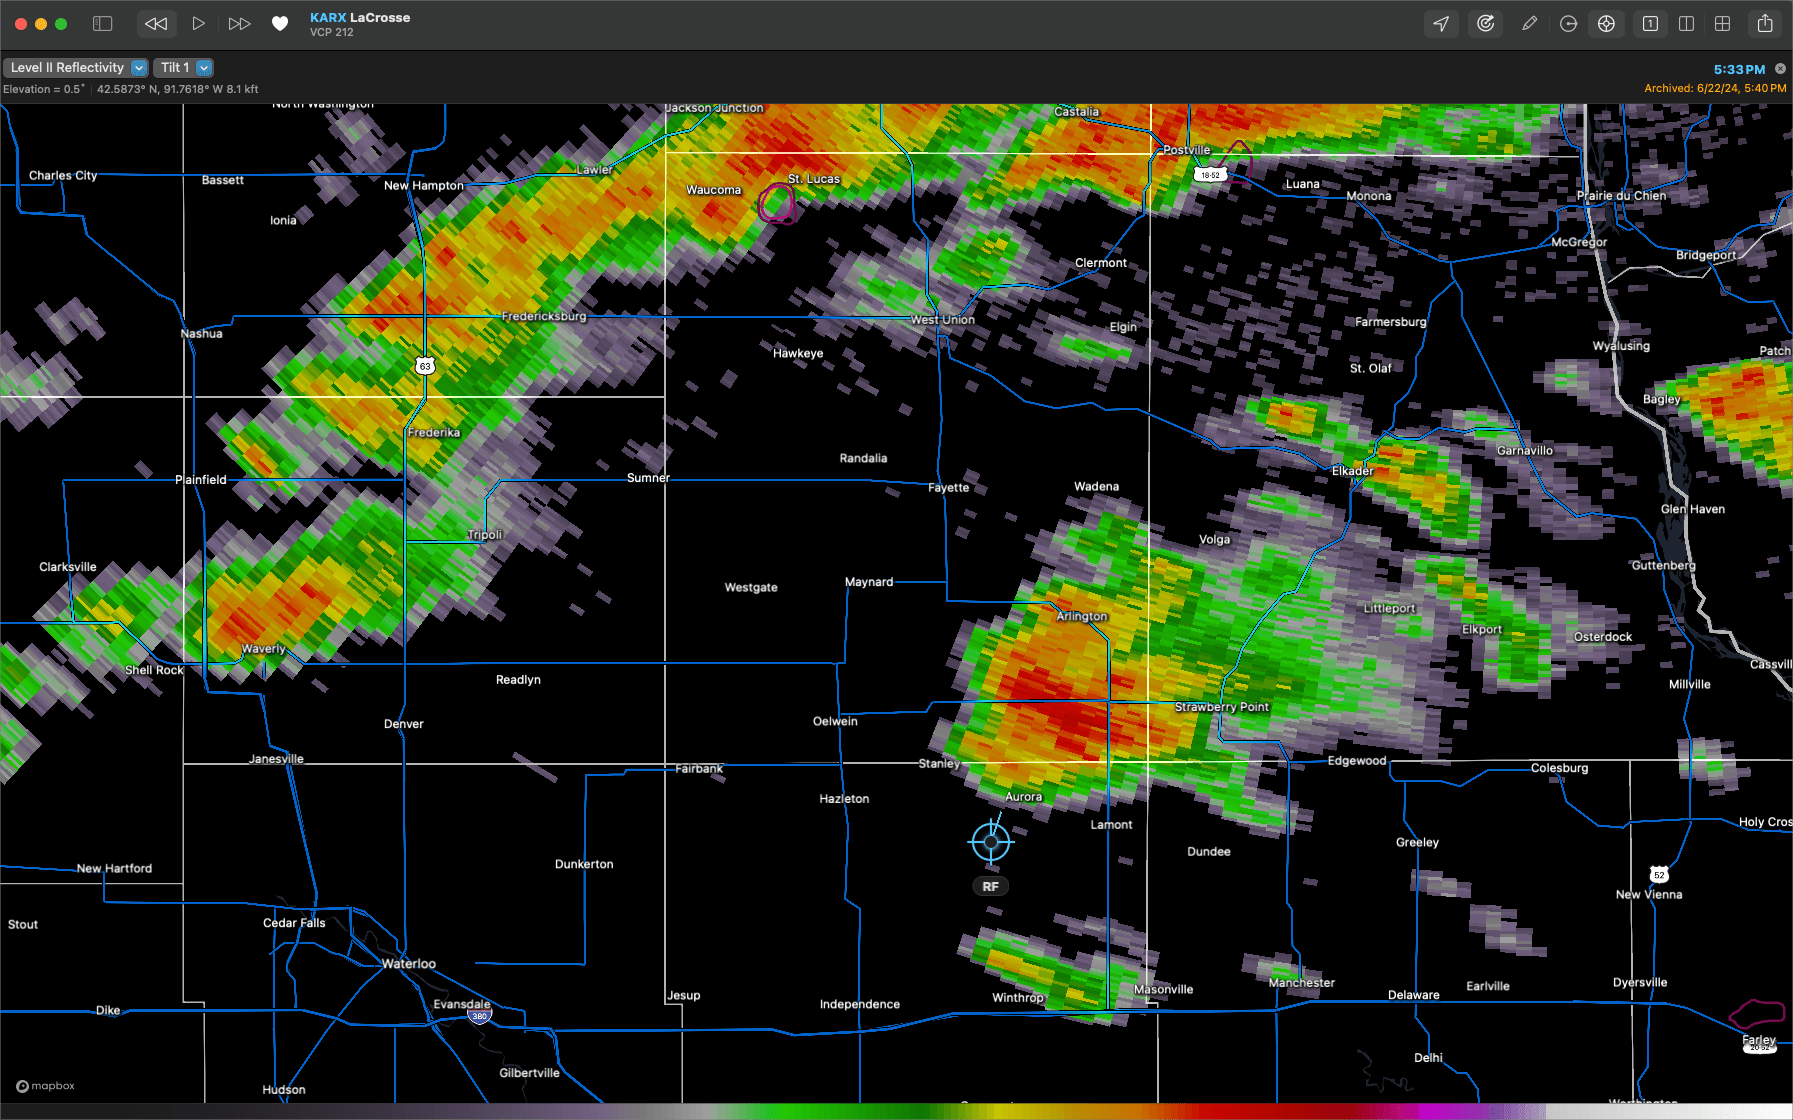
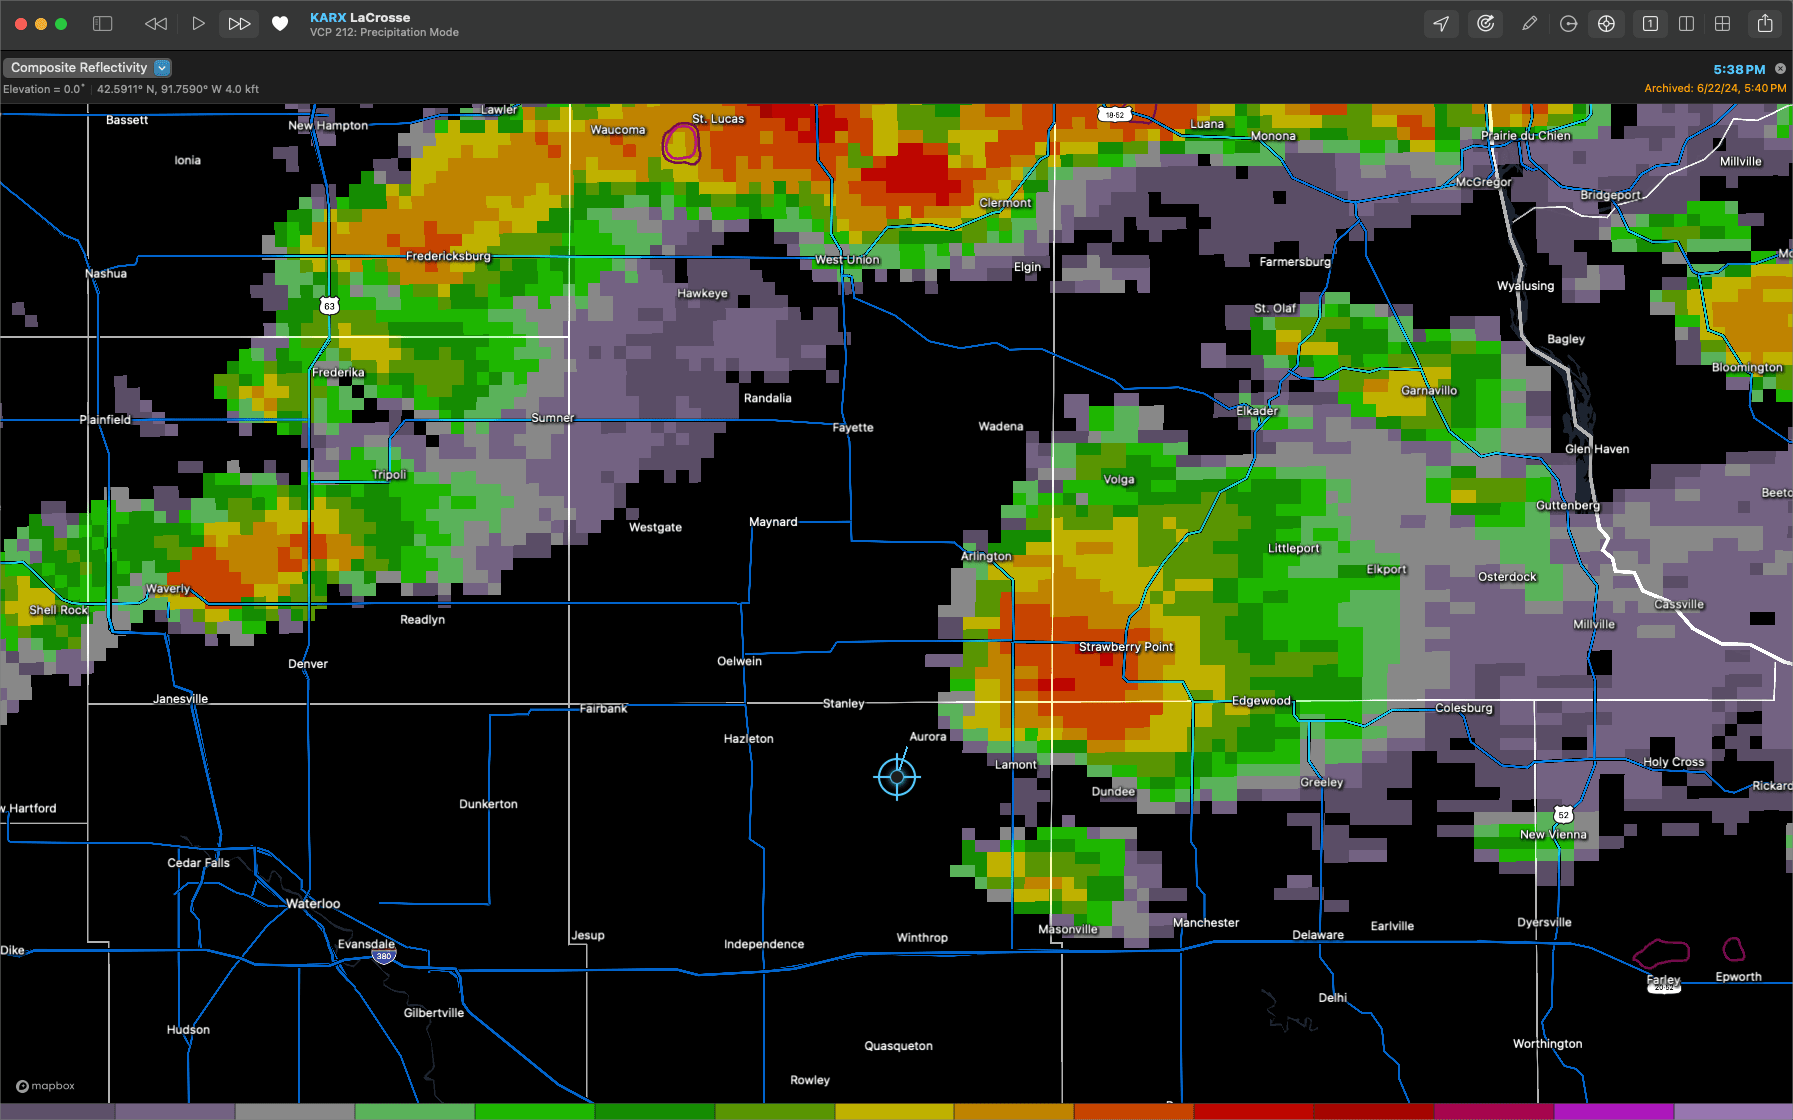
There are some key details to point out in these images:
- The Composite Reflectivity image is significantly further ahead on the map (caused by the delay taken to capture all the elevations)
- The Composite appears to show a wider area of strength in the storm, which is misleading compared to 0.5°
- The Composite is missing some key features, like the inflow tail (just north of Dundee)
- The Composite Reflectivity has a lot storm structure resolution (detail) than the Base Reflectivity.
Three Body Scatter Spike
Hail ReflectionsThe Three-Body Scatter Spike (TBSS) is a distinctive radar artifact that appears as a spike or “flare” extending away from the storm, directly opposite the radar location.
This signature resembles a meteorological “shadow” pointing away from the radar.
How It Forms:
- Radar energy hits large hailstones in the storm
- Echo scatters downward to the ground
- Echo reflects back up to the hailstones
- Echo finally returns to the radar
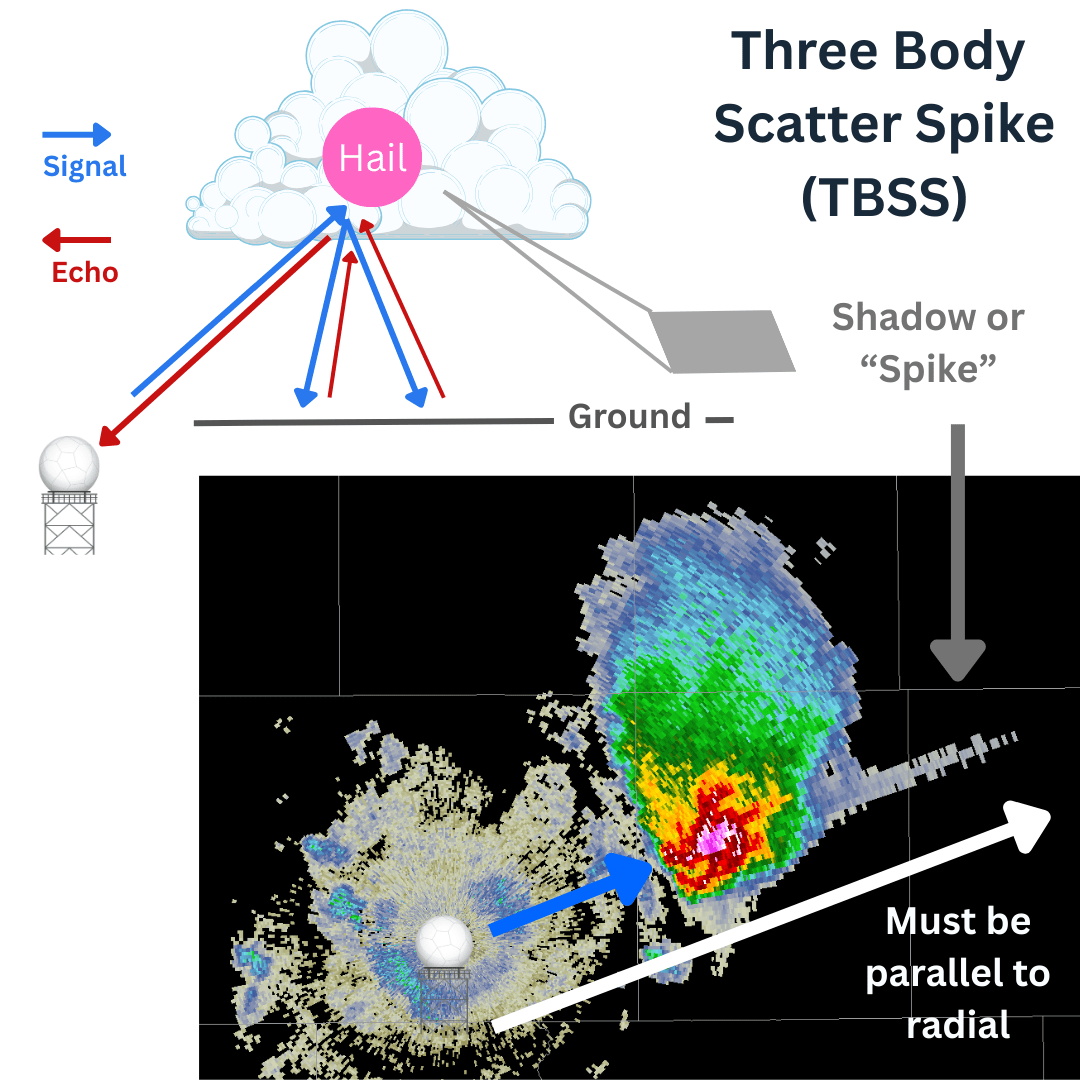
This complex path the signal takes, reflecting to the ground and back to the hail - before back to the radar, creates a time delay that the radar interprets as distance , producing the characteristic spike extending beyond the actual storm.
The TBSS is a reliable indicator of significant hail within a thunderstorm, typically associated with hailstones at least 1 inch (2.5 cm) in diameter.
Velocity
Let’s compare the two velocity images below. They were pulled from the archive during the same volume scan.
Wind at Different Levels
Notice how Tilt 1 shows some nice storm features, but Tilt 2 has significantly reduced values (brightness) and definition.
This is because, at this distance, Tilt 2 is nearly 14kft above ground level (almost twice as high as Tilt 1).
This doesn’t mean we avoid higher tilts altogether. In fact, the opposite! Here, Tilt 2 is giving us a good indication of how ‘deep’ (high) the rotation is occurring.
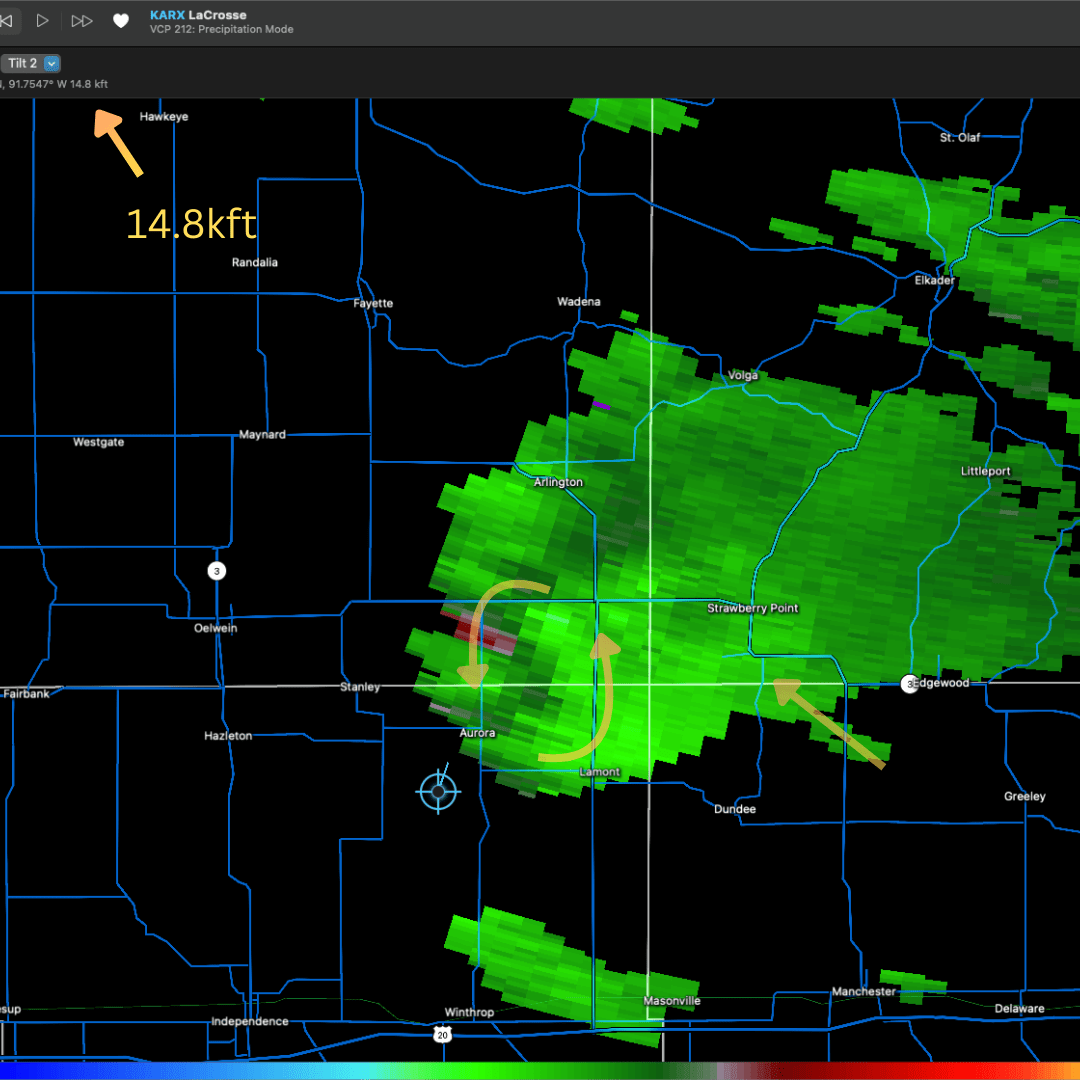
The point of comparing these two images shows us how analyzing just a single tilt can only tell us part of the story. Looking at different tilts, can tell us a completely different story about that part of the storm entirely.
Convergence and Divergence
Other Products
The radar can calculate and produce other products from the data in the Base Products .
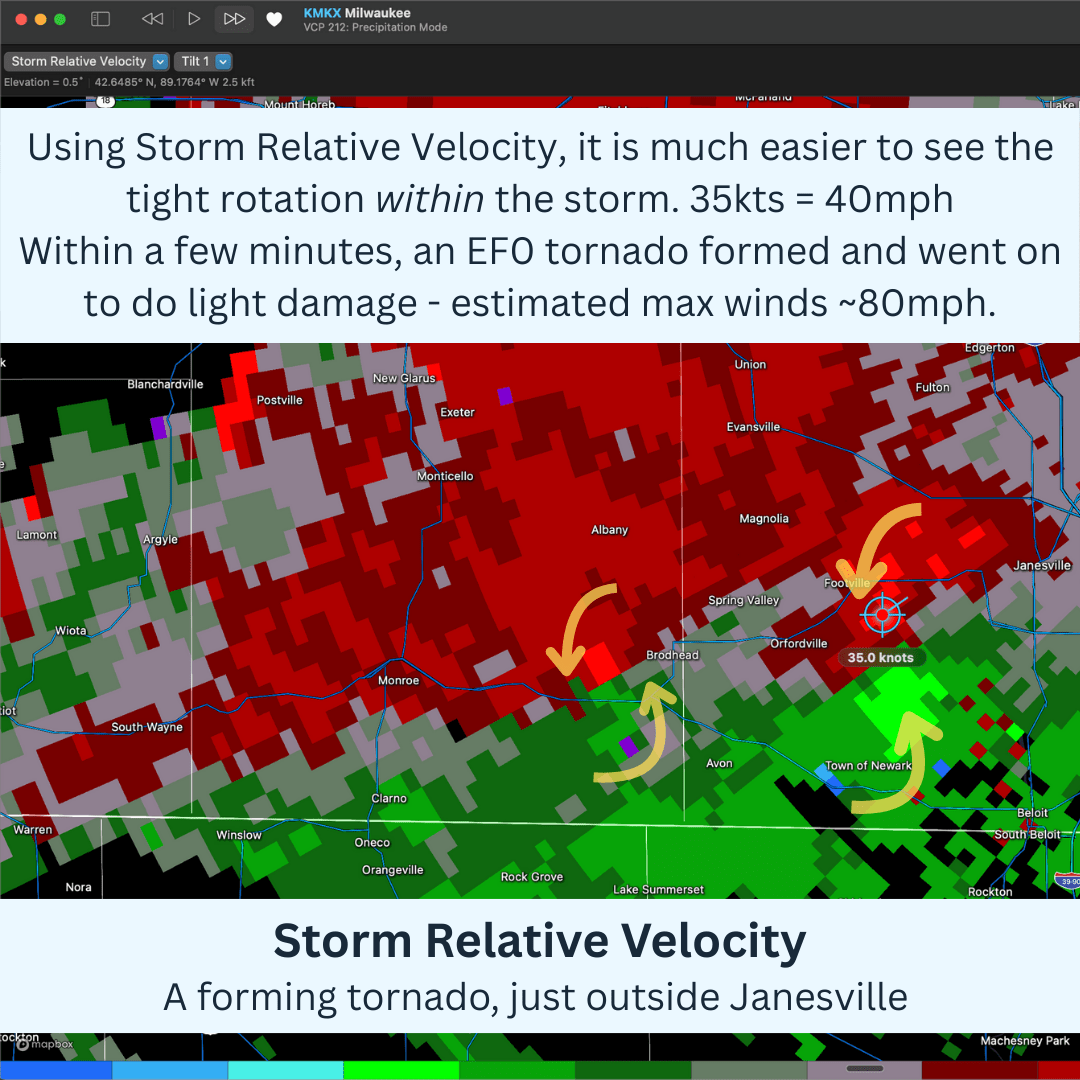
Storm Relative Velocity (SRV)
Detecting RotationStorm rotation can be difficult to interpret on Base Velocity, especially if a storm is moving quickly.
Storm Relative Velocity (SRV) is a helpful product because it removes a storm’s general motion and shows just the movement of wind within the storm.
Detecting rotation (e.g. mesocyclone or tornado) from a radar scan requires are a number of advanced concepts and techniques.
Here are some considerations:
Colors
Rotation will NOT always be “Green and Red touching” with opposing colors close to one another. If you are in doubt, don’t guess, verify with different products and elevations.Storm Location Relative to Radar
See the image below. A storm moving rapidly towards or away from a radar may mask rotation.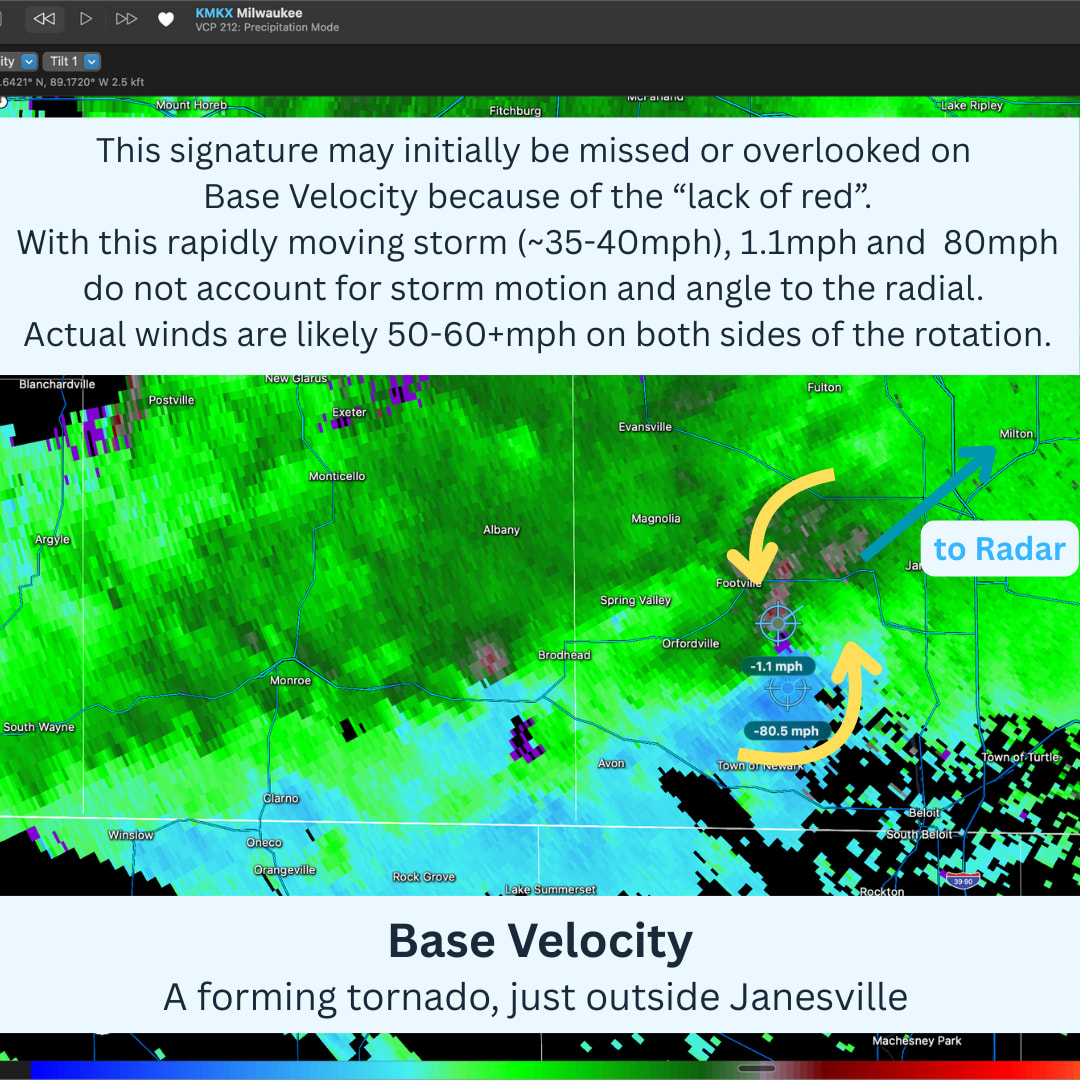
Velocity should always be paired with other products (e.g. Spectrum Width) and you should never look at a single image. Especially when identifying features such as mesocyclone or tornado, it is important to look for sustained rotation (visible in 2+ scans). Downbursts and other artifacts can lead to false indicators on a single velocity image.
Rotation is typically counter-clockwise in the Northern Hemisphere (but not always!). To determine this, and other characteristics, it is critical to know where the radar is in relation to what you are analyzing!
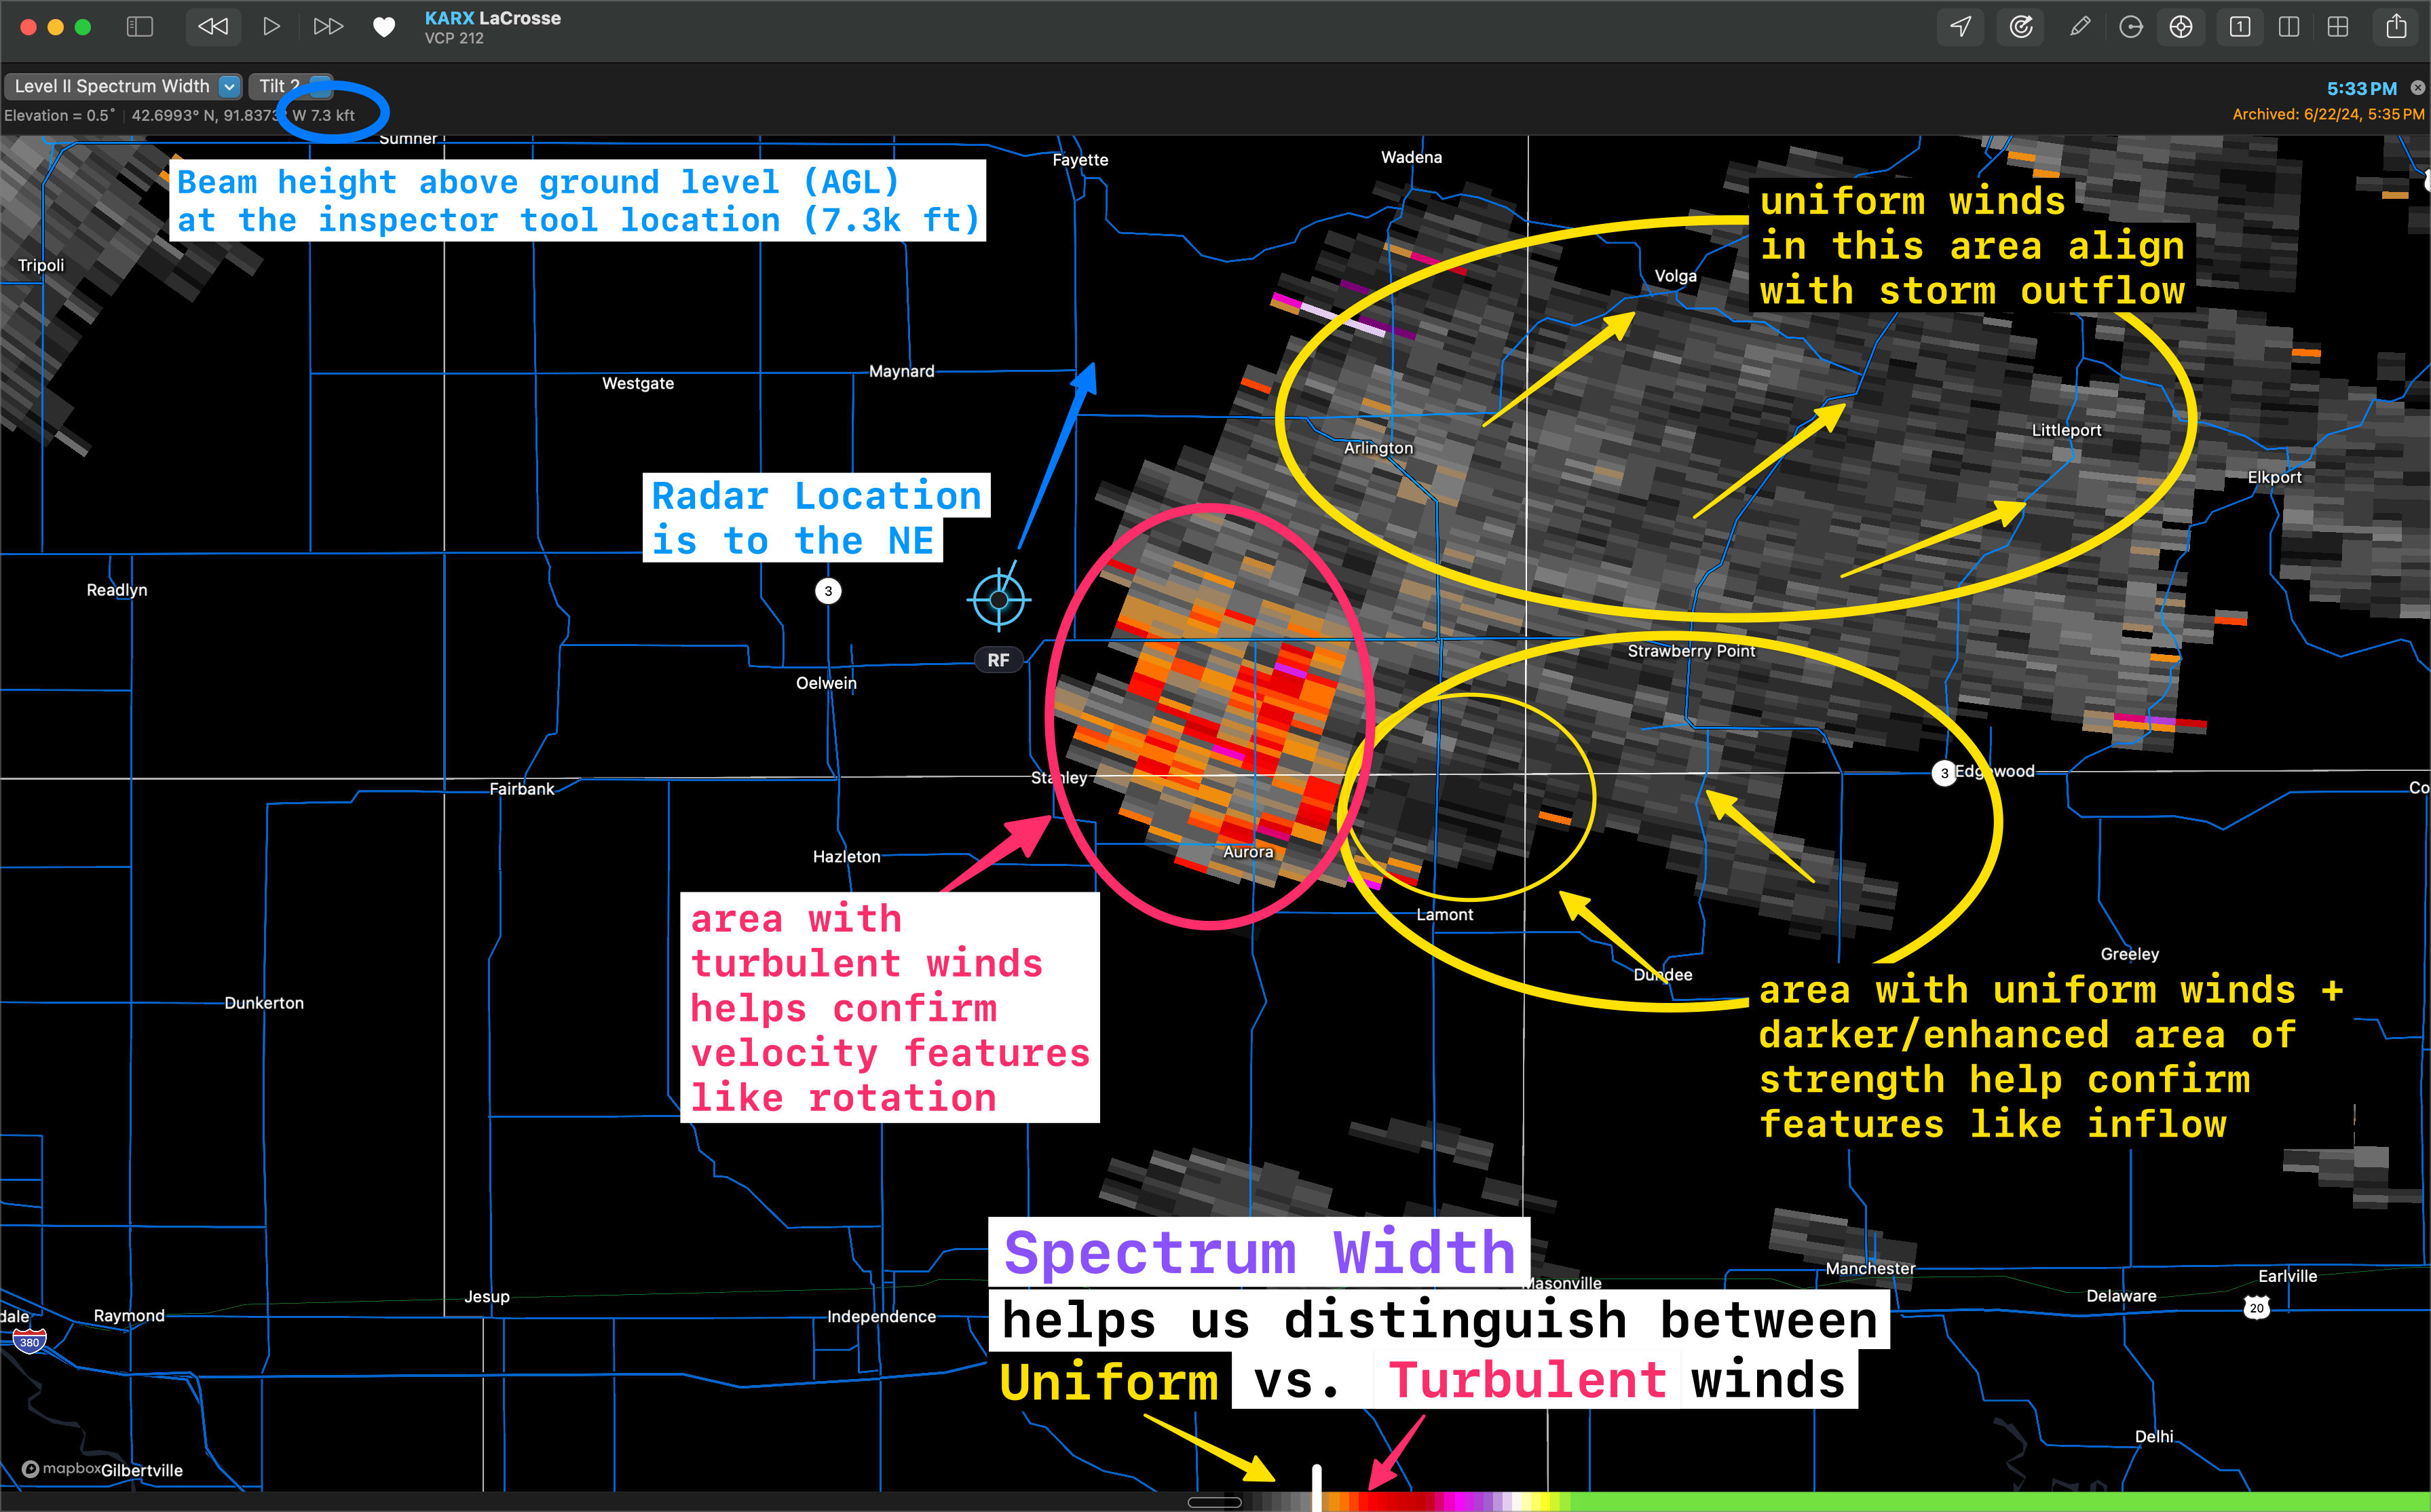
Spectrum Width (SW)
The Chaos ValidatorSpectrum Width is a critical and often over-looked product from the radar. It measures the turbulence of the atmosphere. Or said another way, how consistent or not the velocity values are to one another.
Use Cases: leading edge of the storm
Low Spectrum Width - places with strong uniform wind
- inflow
- RFD
High Spectrum Width - places with chaotic wind
- convective boundaries or fronts
- mesocyclone or tornadic signatures
Lastly, look at the Spectrum Width scan below.
Remember that:
- areas of high spectrum width (bright orange here) = high turbulence
- areas of low spectrum width (gray colors) = low turbulence, uniform winds
It’s clear to see from the Spectrum Width values:
- large areas of uniform wind (yellow circles) - which validates where we were hypothesizing the storm’s inflow and outflow
- large area of turbulence (red circle) which sits smack dab over the broad area of rotation we noted
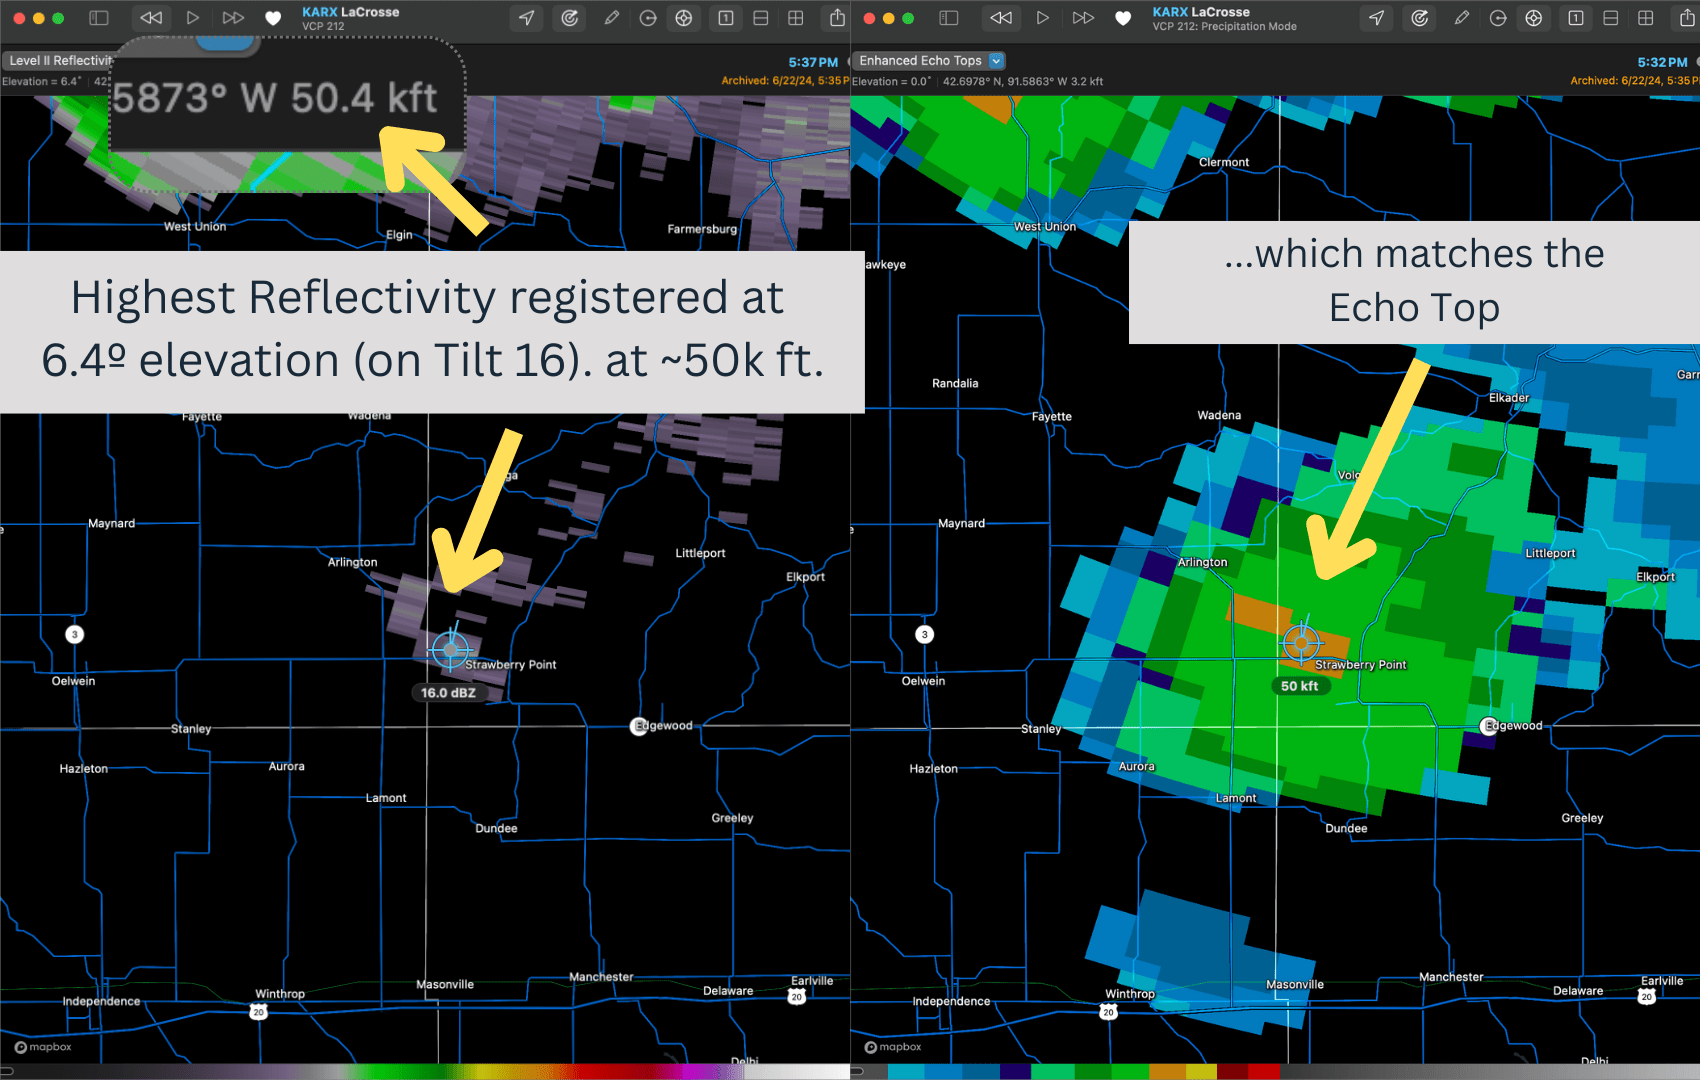
Echo Tops
While Echo Tops is technically not a “base product”, it is derived from Reflectivity (which is).
Echo Tops measures of the max height of any reflectivity over 18dBZ. This is essentially tells us the height of a storm and a great way to get a quick read on convection.
The greater the convection , the greater heights water droplets will reach. We can monitor these values over time to determine things like, “are the tops growing in height/size?” or “are they collapsing?”
Dual-Polarization Products
Dual-Polarization opens the doors to a number of advanced products and capabilities
Differential Reflectivity (ZDR)
measuring circular shapeDifferential Reflectivity measures how close to a perfect circle an object is.
Values are measured on a scale from -8 (perfectly tall) to +8 (perfectly flat)…where 0 is perfectly circular.
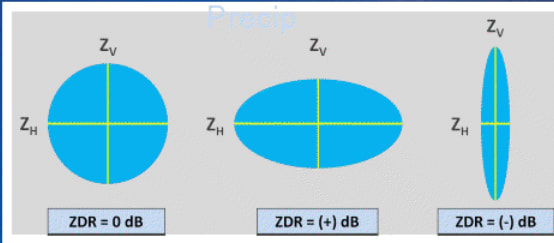
For example:
Hail stones have a relatively circular shape and register a ZDR value close to 0
Rain drops fall and form a pancake shape which will show up as a (positive) +ZDR
Debris flung in the air by a tornado will register a vertical shape with a (negative) -ZDR.
See the table below on common ZDR readings.
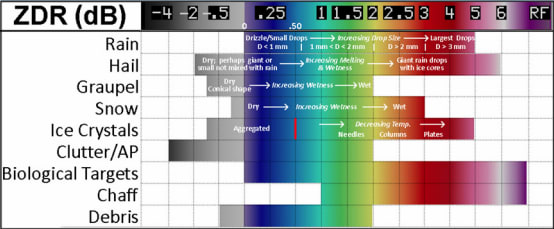
| Vertical (-) | Circular (0) | Horizontal (+) |
|---|---|---|
| Hail (-1 to 0 dB) | Light Rain (0.5 to 2.0 dB) | |
| Heavy Rain (2.0 to 3.5 dB) | ||
| Large Drops (3.5 to 5 dB) | ||
| Dry Snow (0 to 0.5 dB) | ||
| Wet Snow (1 to 3 dB) | ||
| Tornado Debris (-4 to -1 dB) | Birds, insects (1 to 4 dB) |
Hail Identification
We often look for a ‘hail core’ in very high reflectivity values of Reflectivity.
In the example below, 60dBZ and higher show up as pink to white.
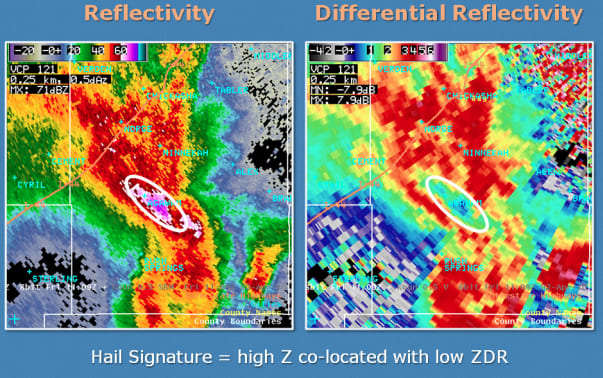
One way to confirm hail is to look at the shape of the objects detected by the radar. Within the suspected hail core, we can see values < 1 dB and close to 0 dB (perfectly circular)…or even possibly negative but still close to 0 dB.
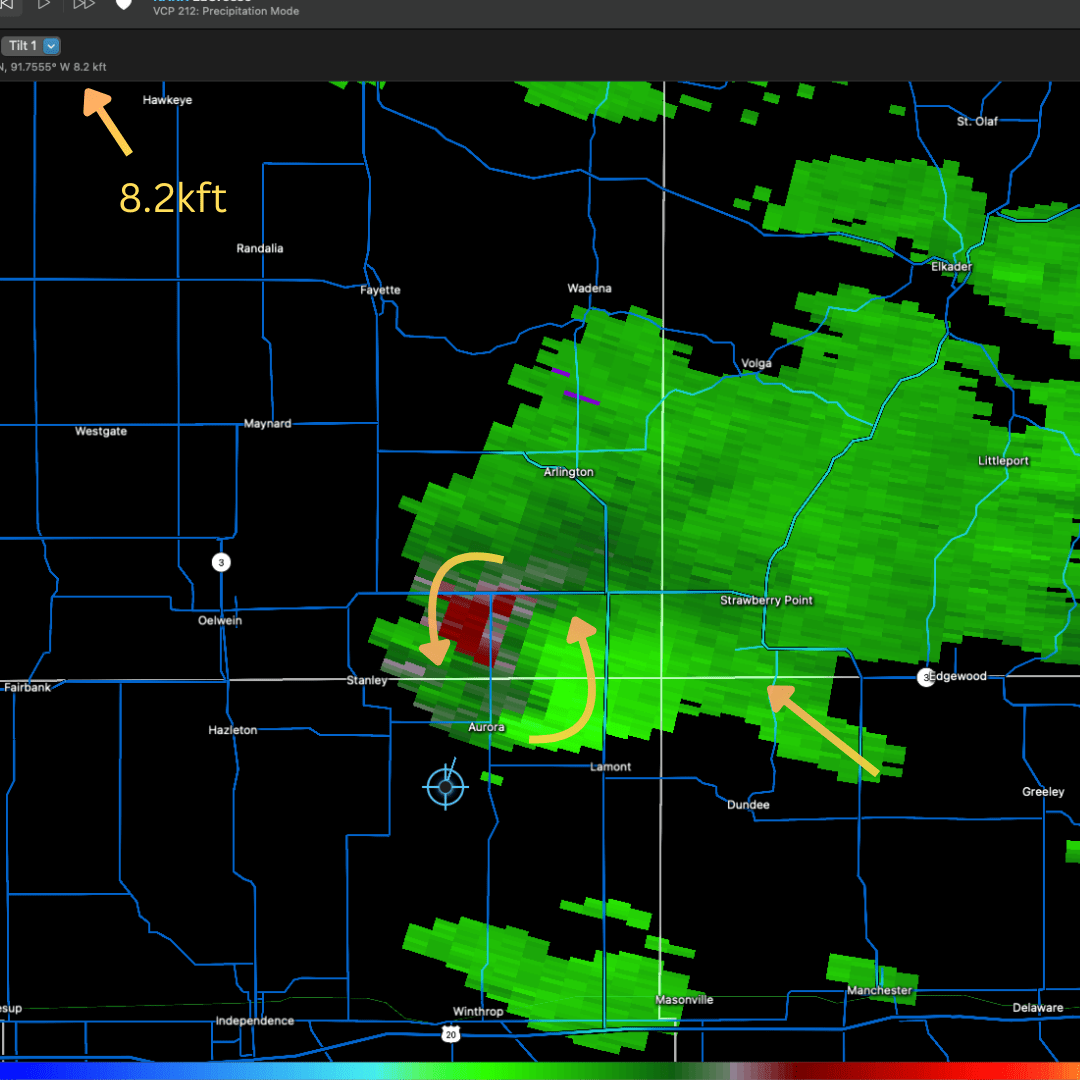
Updraft
An updraft can be see within the more dense part of Reflectivity (left). On the ZDR (right), small areas of enhanced (> 2 dB) values can indicate rain drops shape. Scanning through multiple tilts will help you understand how high isolated column of rain is getting lifted via the updraft. Eventually you will hit an area of surrounding lower dB values (in the example image below right), with an isolated column of HIGHER dB values representing the counter-clockwise inflow/updraft.
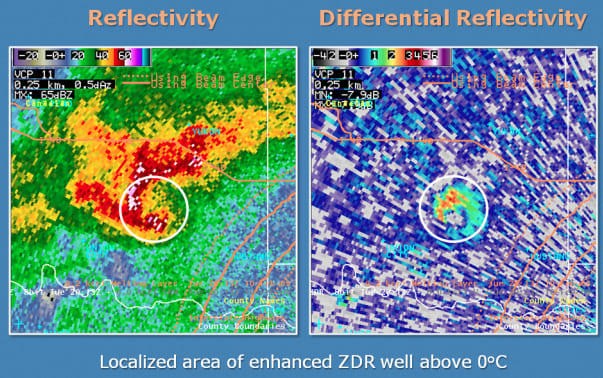
This would be different/opposite than tornado debris, because tornado debris will show the rain around it (high dB surrounding area) and then an isolated area of LOWER dB values representing the debris.
Melting Layer
where hail melts to rainWhat layer of the atmosphere is ice crystals melting to rain. Scanning through tilts, you can see in the image below from the 3.4° tilt a ring of noisier ZDR. As more uniform snow/ice melts it takes on a more horizontal shape.
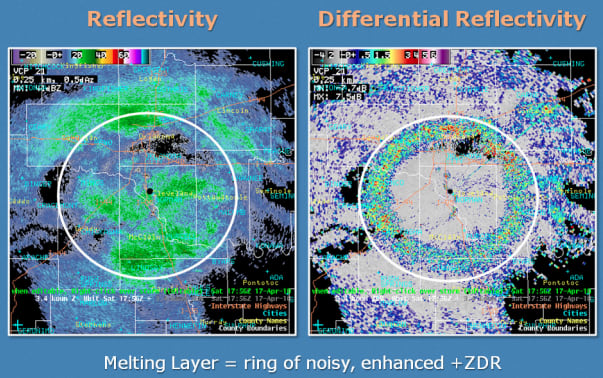
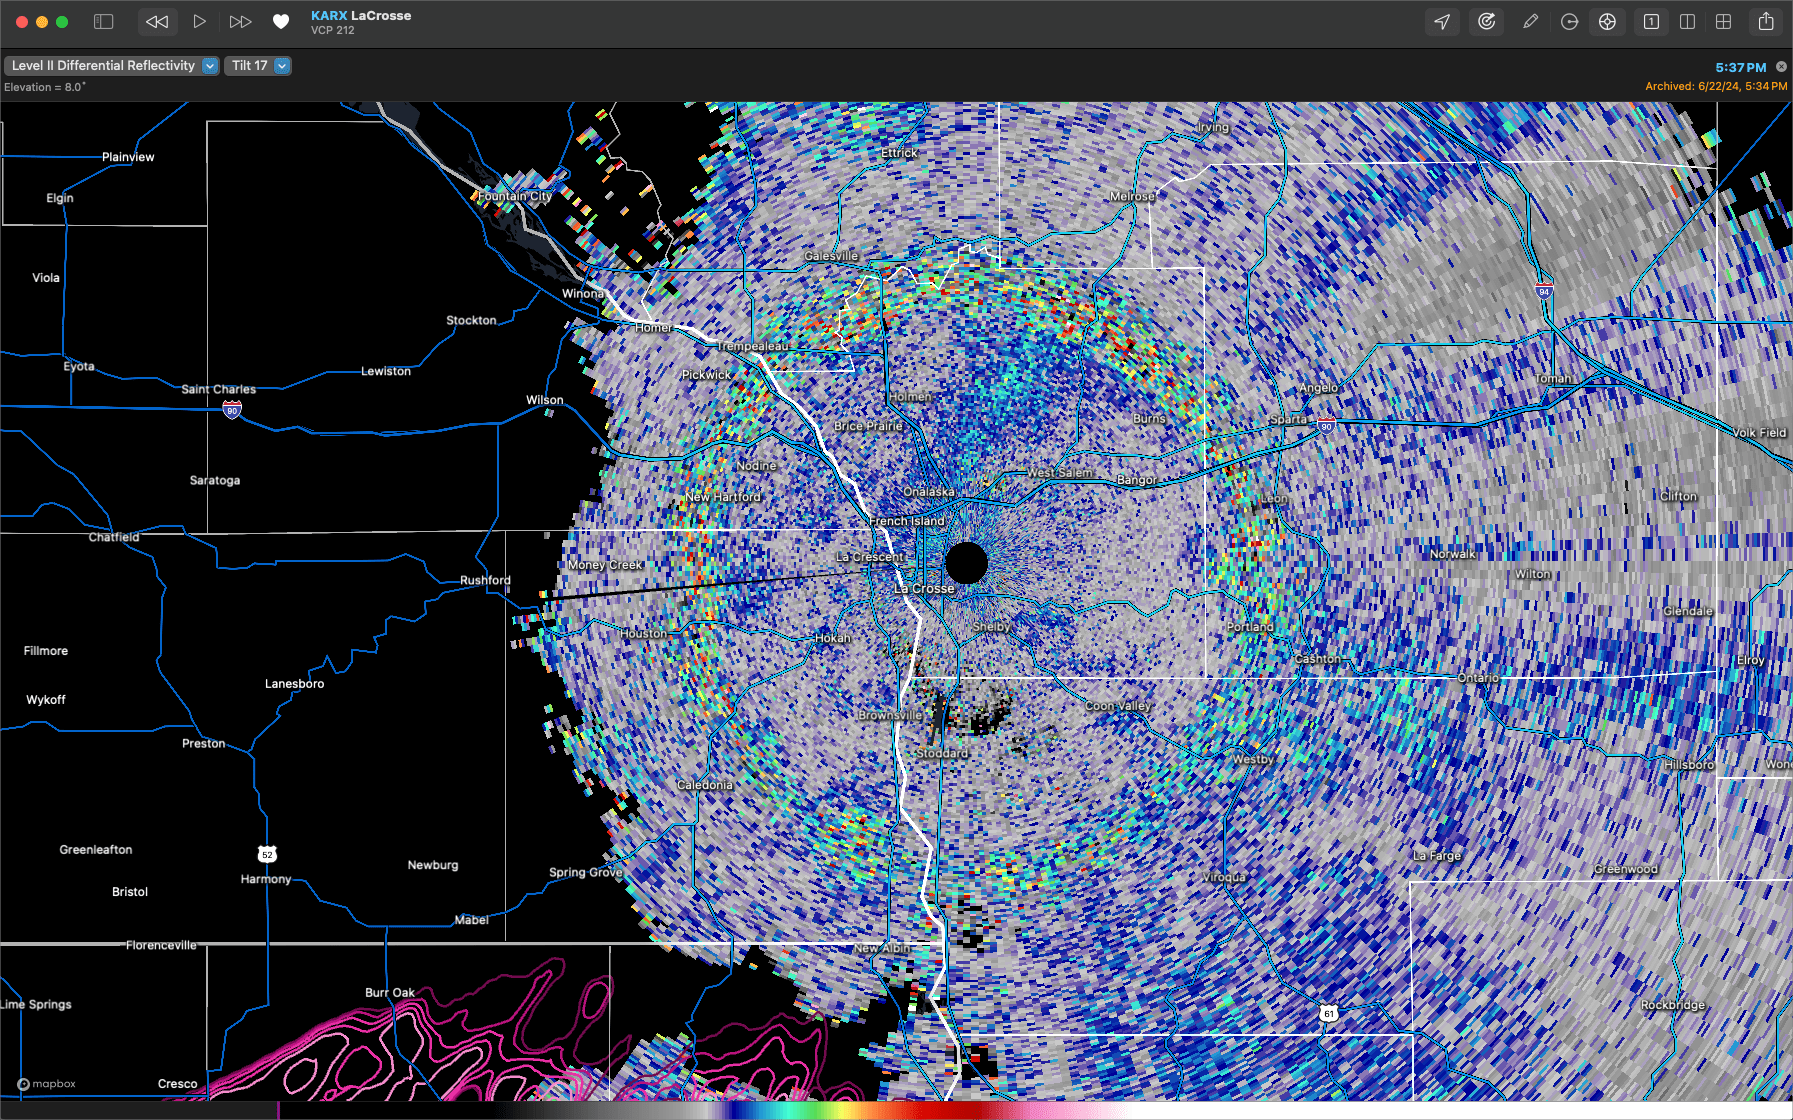
From our storm chase example, you can see the melting layer here.
Correlation Coefficient (CC)
how similar (or not) items are compared to one anotherCorrelation Coefficient measures how similar the objects in a scan area to one another.
There are a number of uses for this type of product, including detecting debris (from a tornado) and determining rain vs. hail.
How it works
If things are perfectly similar, the value will be 1. How much lower the value is from 1, represents how dissimilar those objects are from one another.
Here is a table of typical CC values on a range and what they can mean
Below are common use cases for Correlation Coefficient.
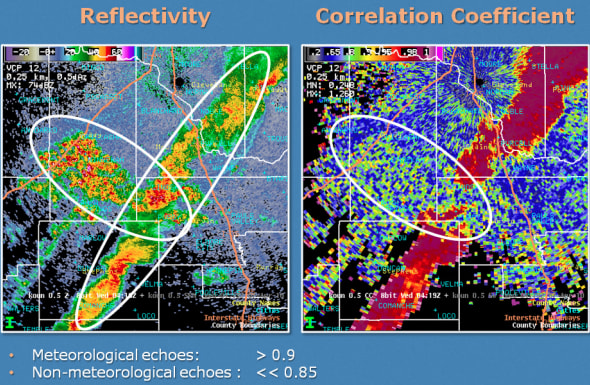
Meteorological vs. Non-Meteorological Things
water vs. insectsBirds, insects, and other undesirable artifacts will show up on Reflectivity, but this will show massive differences in CC values. (Water and bugs are not similarly shaped). Values are less important here. You can can see weird Reflectivity on the left with a clear matching “difference” (gap) in CC on the right.
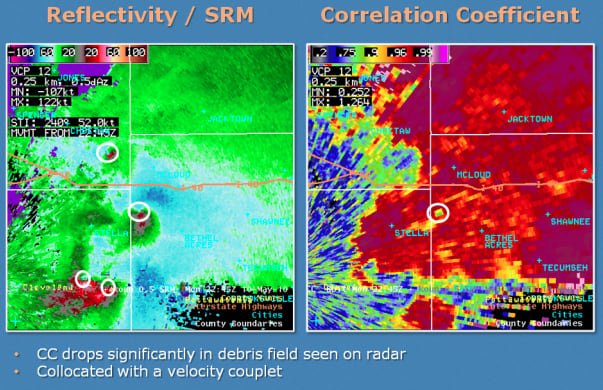
Tornado Debris
Location of a tornado should be correlated with Reflectivity (Z) and Velocity (V) products. CC can help confirm touchdown and intensity by seeing debris in the air. This is extremely helpful for nighttime or rain-wrapped tornadoes.
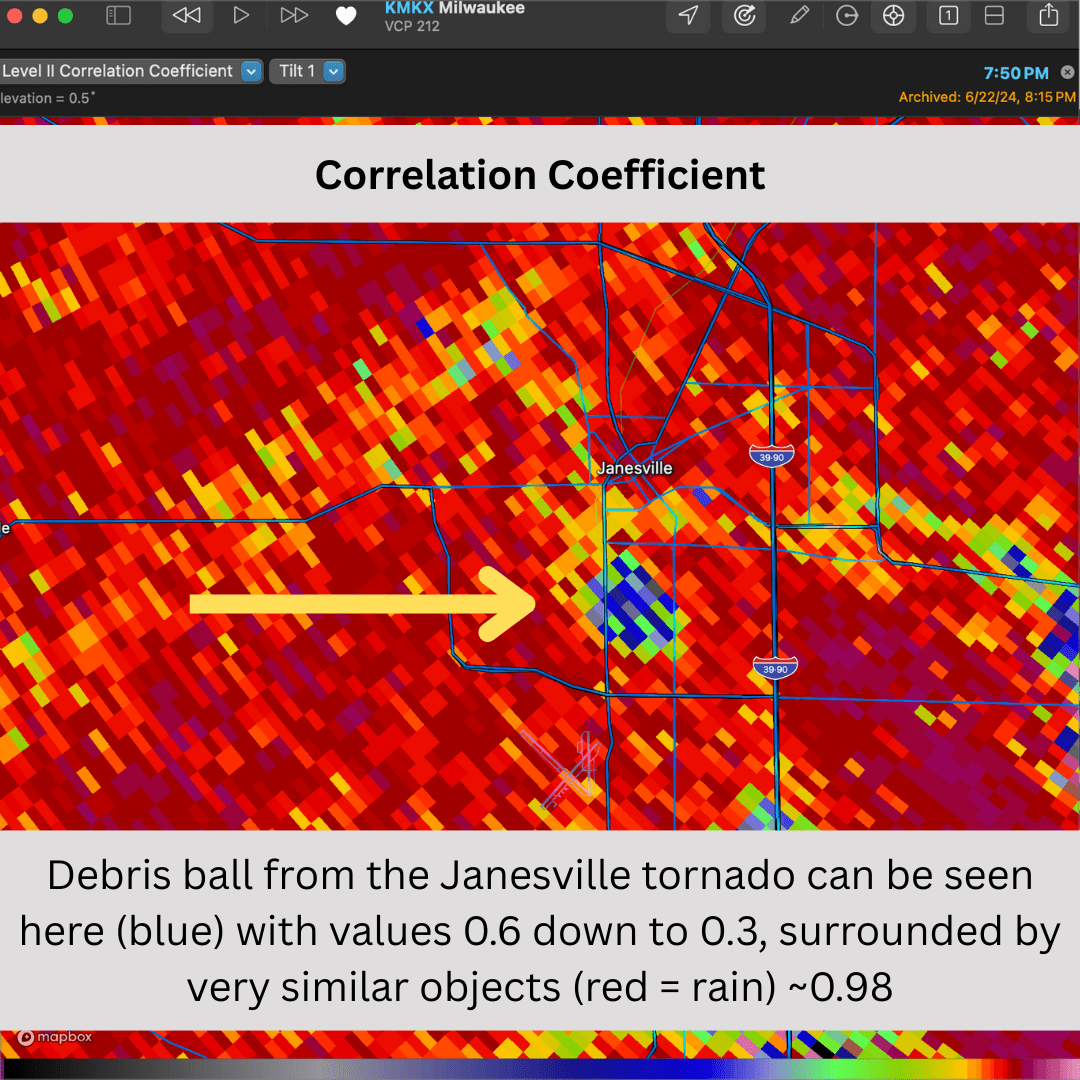
And here is a radar image from the storm chase:
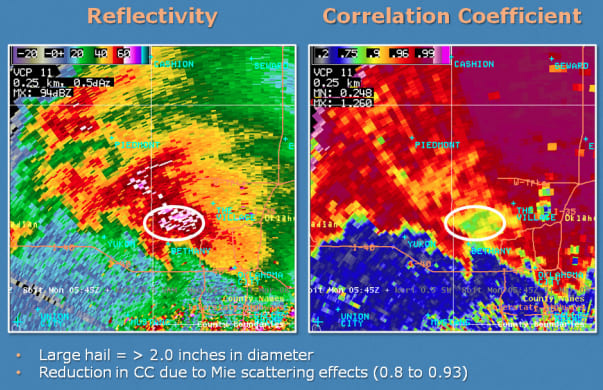
Giant Hail
hail > 2” diameterWe often look for a ‘hail core’ in very extreme reflectivity values on Reflectivity (in the example below, 60dBZ and higher show up as pink to white). A way to determine how BIG the hail is, could be to use CC. Using CC, hail within that high dBZ reflectivity area will typically show up lower than 0.93 and be as low as 0.8 for +3.5” hail.
Melting Layer
where hail melts to rainWhat layer of the atmosphere is ice crystals melting to rain. Low CC values (0.85) surrounding higher values (0.98) can have a signature ‘donut’ shape. Keep in mind Principle #2 above. The ring away from the radar represents both distance AND elevation…so while you think of this as the distance from the radar (true) the more important takeaway is the elevation that beam is at.
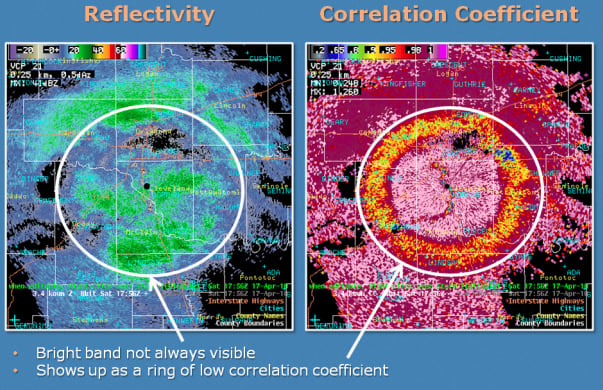
And here is a look at the melting layer on a radar image from the storm chase:
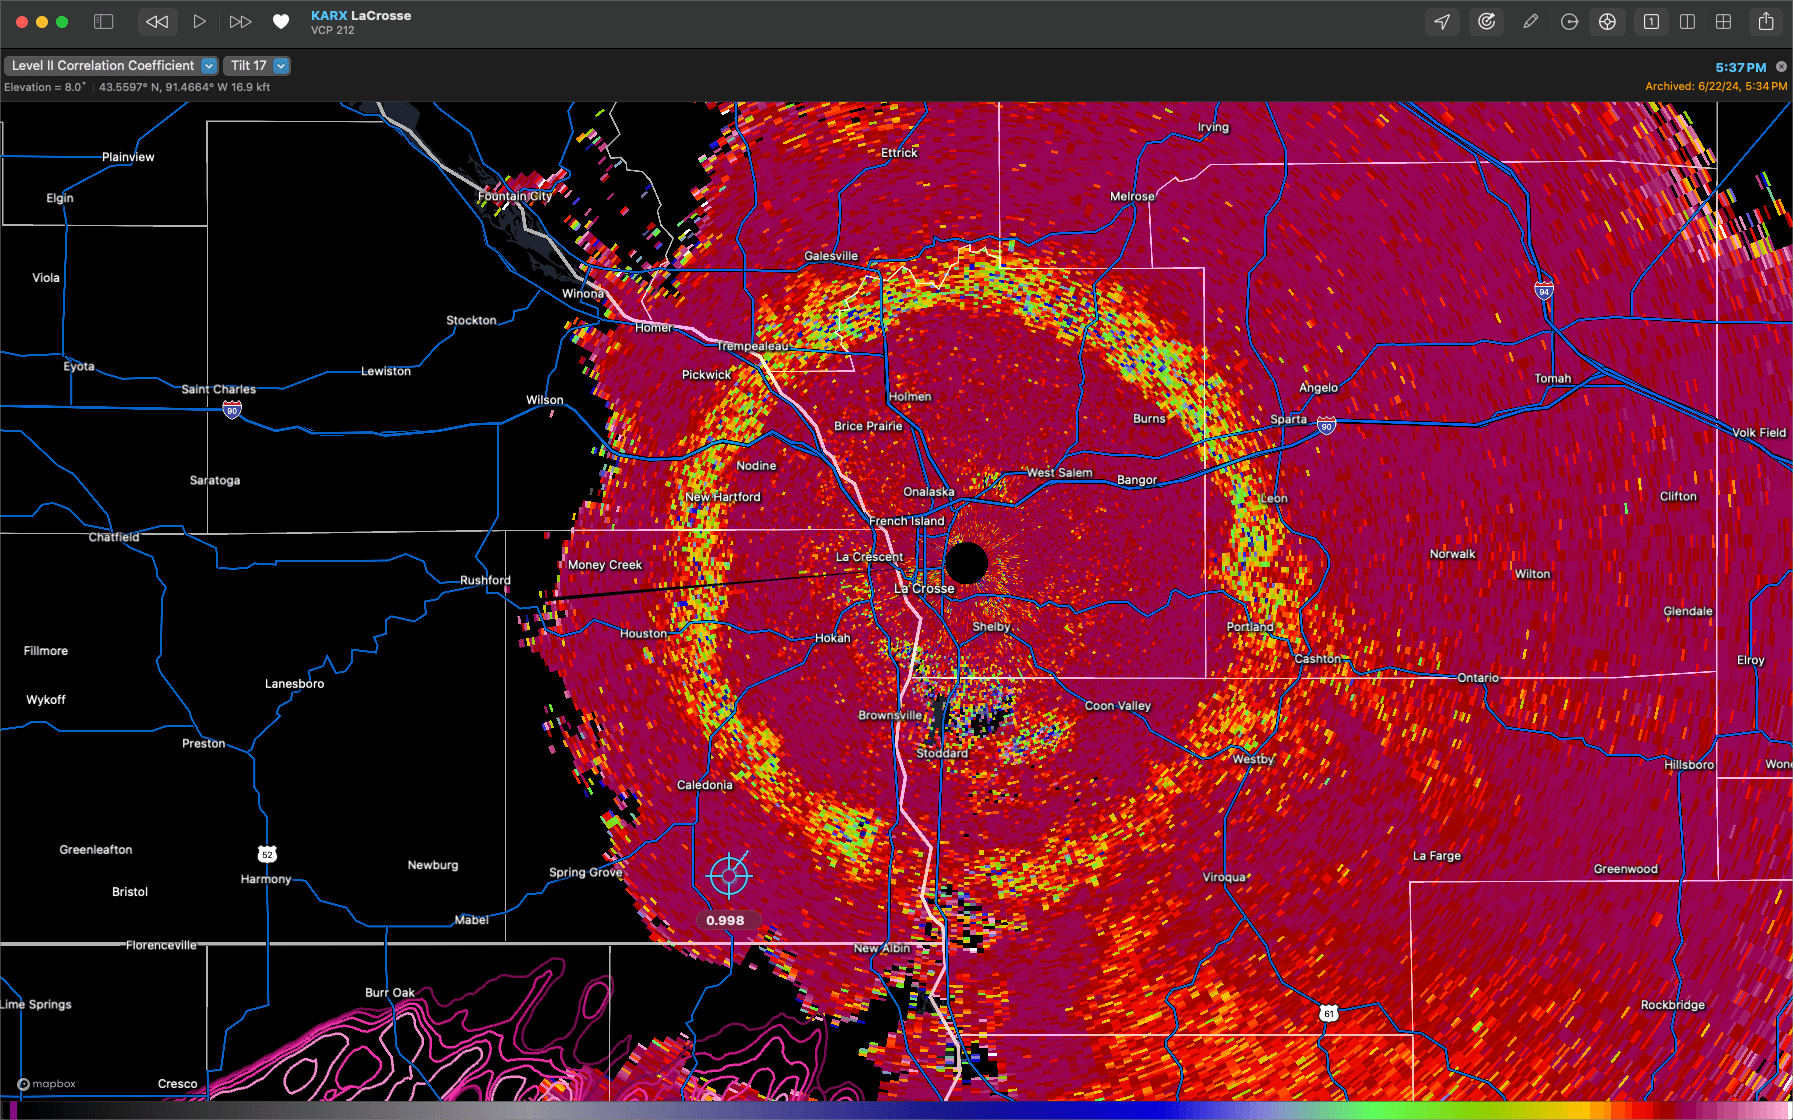
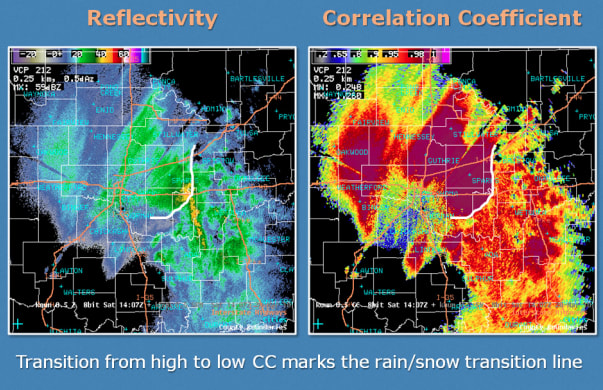
Rain vs. Snow
The white line represents the Rain/Snow line. East of the line, values are 0.9 to 0.95 (think ”difference = downpour”). West of the white line values are 0.99 (”same = snow”)
Specific Differential Phase (KDP)
shape andKDP measures the phase shift between horizontal and vertical pulses as they travel through precipitation.
KDP Use Cases
Specific Differential Phase is particularly useful for:
- identifying areas of heavy rain
- distinguishing between rain and hail
- improving rainfall estimation, especially in intense precipitation
Summary
Other Radar Products
Multi-Radar Multi-Sensor (MRMS) Systems
MRMS combines data from multiple radars with satellite imagery, lightning detection networks, surface observations, and numerical models to create a comprehensive picture of the atmosphere.
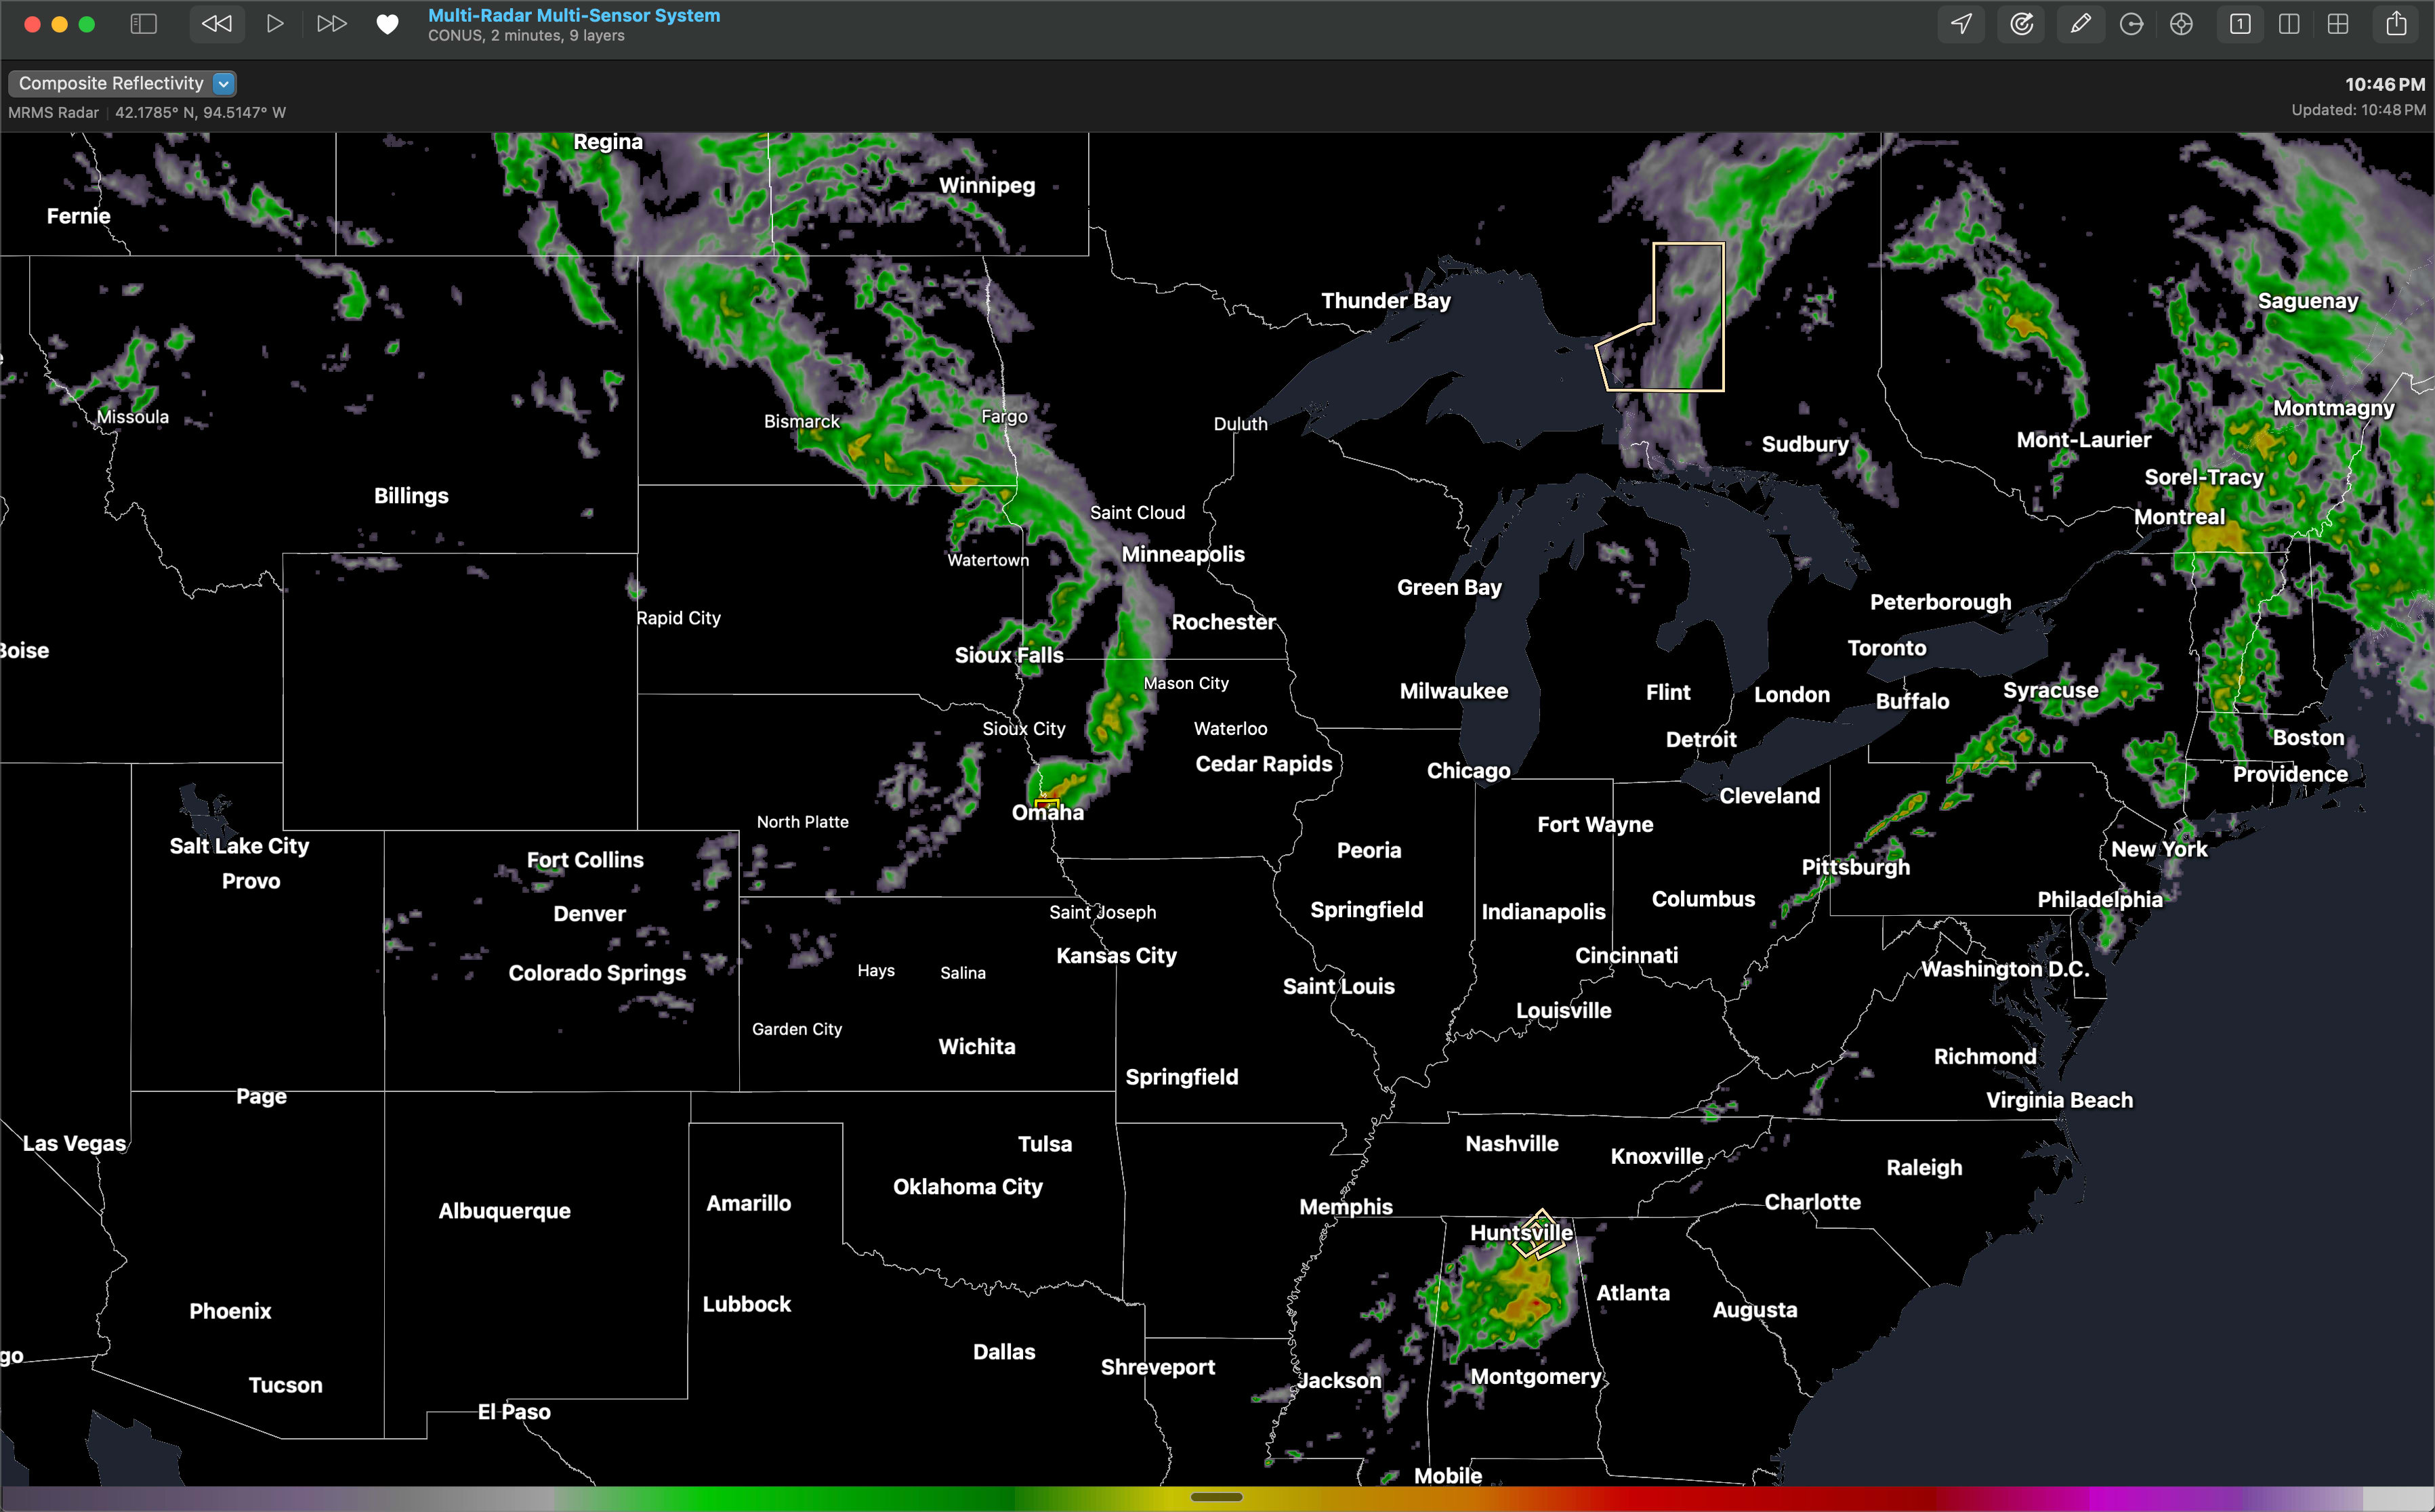
Benefits of MRMS include:
- Filling in gaps between individual radars
- Providing a seamless mosaic of radar data
- Combining different data sources to improve accuracy
- Generating specialized products like rotation tracks and hail size estimates