Enjoy this content?
Click to make it sunny!
Introduction
Most people associate the polar vortex with bone-chilling winter temperatures, but the Polar Vortex is actually a year-round phenomenon! -a massive atmospheric whirlpool of cold air, circuling Earth's poles, that is until it breaks free!
TL;DR
The Polar Vortex is a large area of low pressure and cold air that circulates around both of Earth’s poles.
Normally, the circling winds help keep that frigid air close to the poles. But, sometimes those winds can weaken which allows that cold, frigid air to leak out, bringing episodes of extreme cold weather.
Let’s take a brief look at what the Polar Vortex is and tools you can use to measure and forecast impacts to weather here in the US.
What is the Polar Vortex?
The term ‘polar vortex’ is the name given to the strong Stratospheric winds that surround low pressure found at the North and South Poles.
These persistent winds are supported by the Earth’s rotation and tilt, but vary in strength seasonally.
The Polar Vortex strengthens during late summer when sunlight near the pole begins to decrease and temperatures drop. During this period, the pole goes months without any sunlight.
These lower temps cause stronger winds. Due to The Coriolis Effect , the Earth’s rotation causes these stronger winds to spin counter-clockwise (west to east).
The spinning winds act like a vortex keeping the cold air at the poles in the center, near the pole.
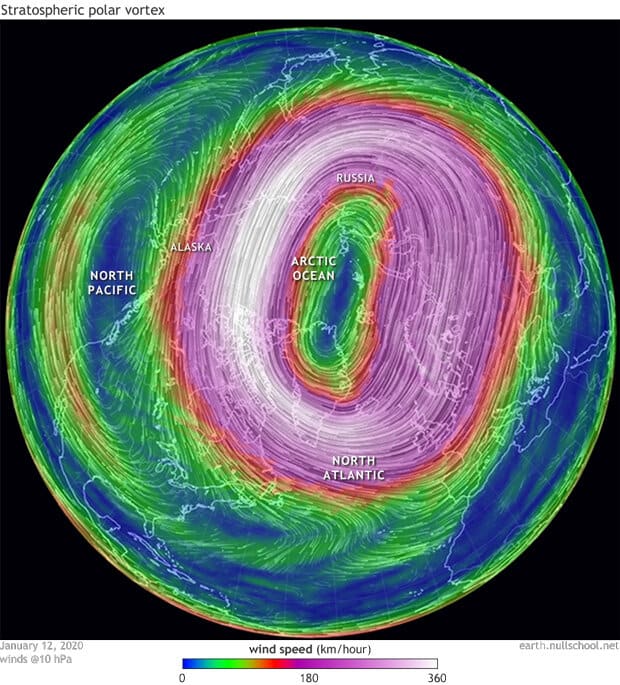
The Polar Vortex is a massive phenomenon. It can sometimes reach 6,000 miles in diameter, which is wider than all of Canada.
In the image below, you can see the concentration of these winds.
Layers of the Atmosphere
The Troposphere (where we live and our weather exists) starts at the surface, around 1000 millibar (mb) pressure and continues up about 10 miles, around 100mb.
See the image below. Along the horizontal axis maps temperature and the vertical maps elevation.
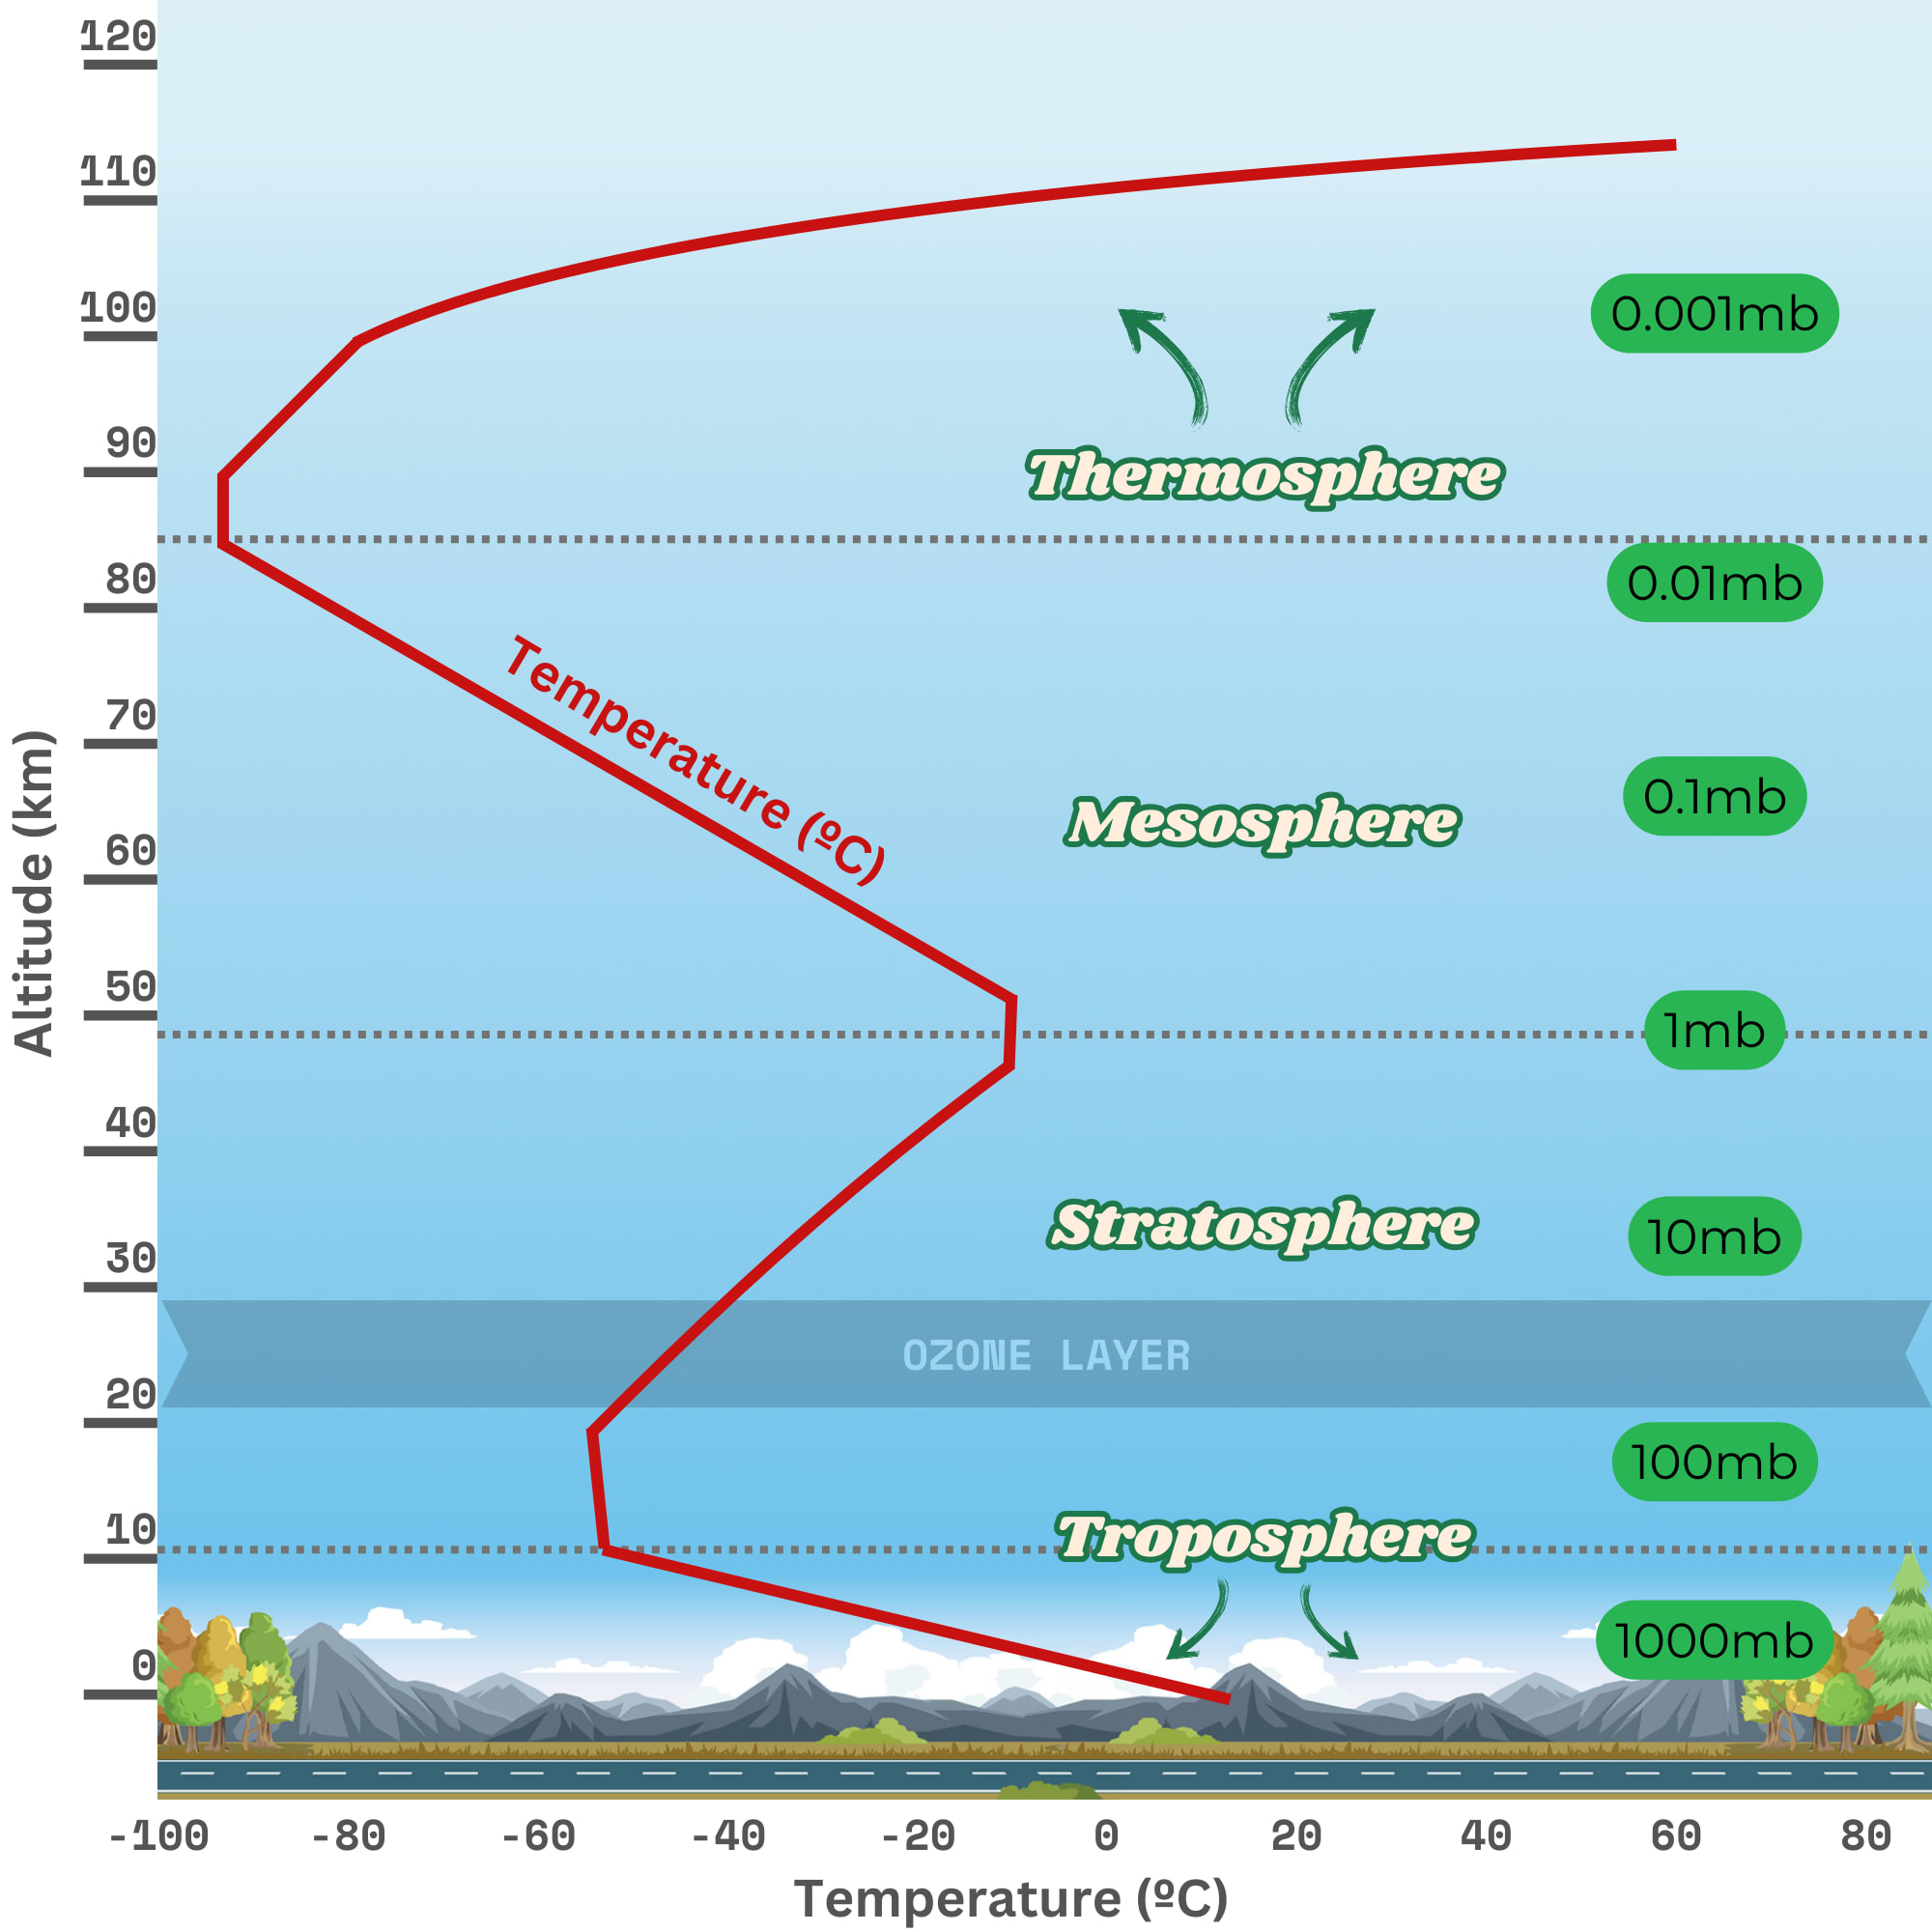
As you travel from the Surface…up the Troposphere…the temperature line plummets drastically to the left, until about the Stratosphere.
This air is part of the frigid arctic air that is held in place by the Polar Vortex.
At around 100mb, the Stratosphere begins and continues up to about 30 miles above the surface, to around 1 mb.
Impact to our weather
When the Polar Vortex is the strongest, it’s the most stable and effective at keep the frigid cold air contained and away.
By now you should realize the Polar Vortex does not mean “a sudden burst of cold air”. A better example for that phenomenon would be an Alberta Clipper .
The Polar Vortex is always there. In fact, when the Polar Vortex is the strongest, it’s the most stable and effective at keep the frigid cold air contained and away.
See the image below - with strong, stable Polar Vortex on the left.
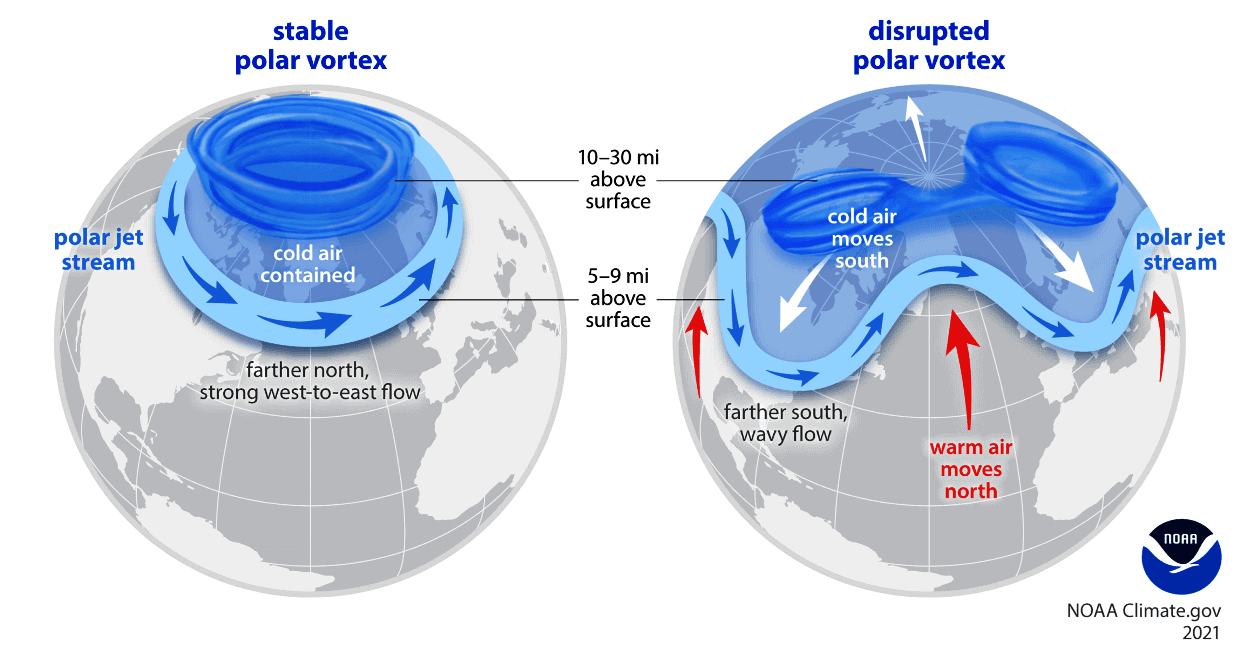
However, certain events can occur which cause a disruption to the vortex, allowing that frigid cold air to leak out and into mid-latitude areas.
Making of the Polar Vortex
There are four main ingredients that contribute to the creation of the Polar Vortex.
Low Pressure
Air is constantly circulating around the planet. Warm and cool air masses create rising and sinking movements which results in low and high pressure systems.
Based on how the Earth works , it results in a persistent low pressure system that sits permanently over the poles.
This low pressure typically goes unnoticed when it is stable, but sets up the foundation we need for the next 3 ingredients.
Cold Arctic Air
The poles get very little sunlight relative to the rest of Earth. Because of this, the air is cold there. It’s significantly colder in the winter and a bit more mild in the summer.
As the cold air sinks, warm air rises around it - replacing the sinking air. This creates a circulation that continues to supports the low pressure!
Jet Stream
Jet Streams are large flows of strong winds, typically westerly (but not always), which drive many characteristics of our weather.
Think of jet streams as the super highways up in the sky, but instead of cars, jet streams move large diverse air masses (warm, cool, moist, dry, etc.) to different parts of the world.
There are several persistent jet streams that meander Earth. For the purposes of Polar Vortex, we care a lot about one certain jet stream, you guessed it: the Polar Jet Stream .
Although jet streams persist in relatively consistent regions of Earth, they are far from stationary. They are constantly morphing and changing speeds, which has a direct impact on the air below (and above!) them.
Jet streams are influenced by another force, a partner in crime if you will, let me introduce: Rossby Waves .
Rossby Waves
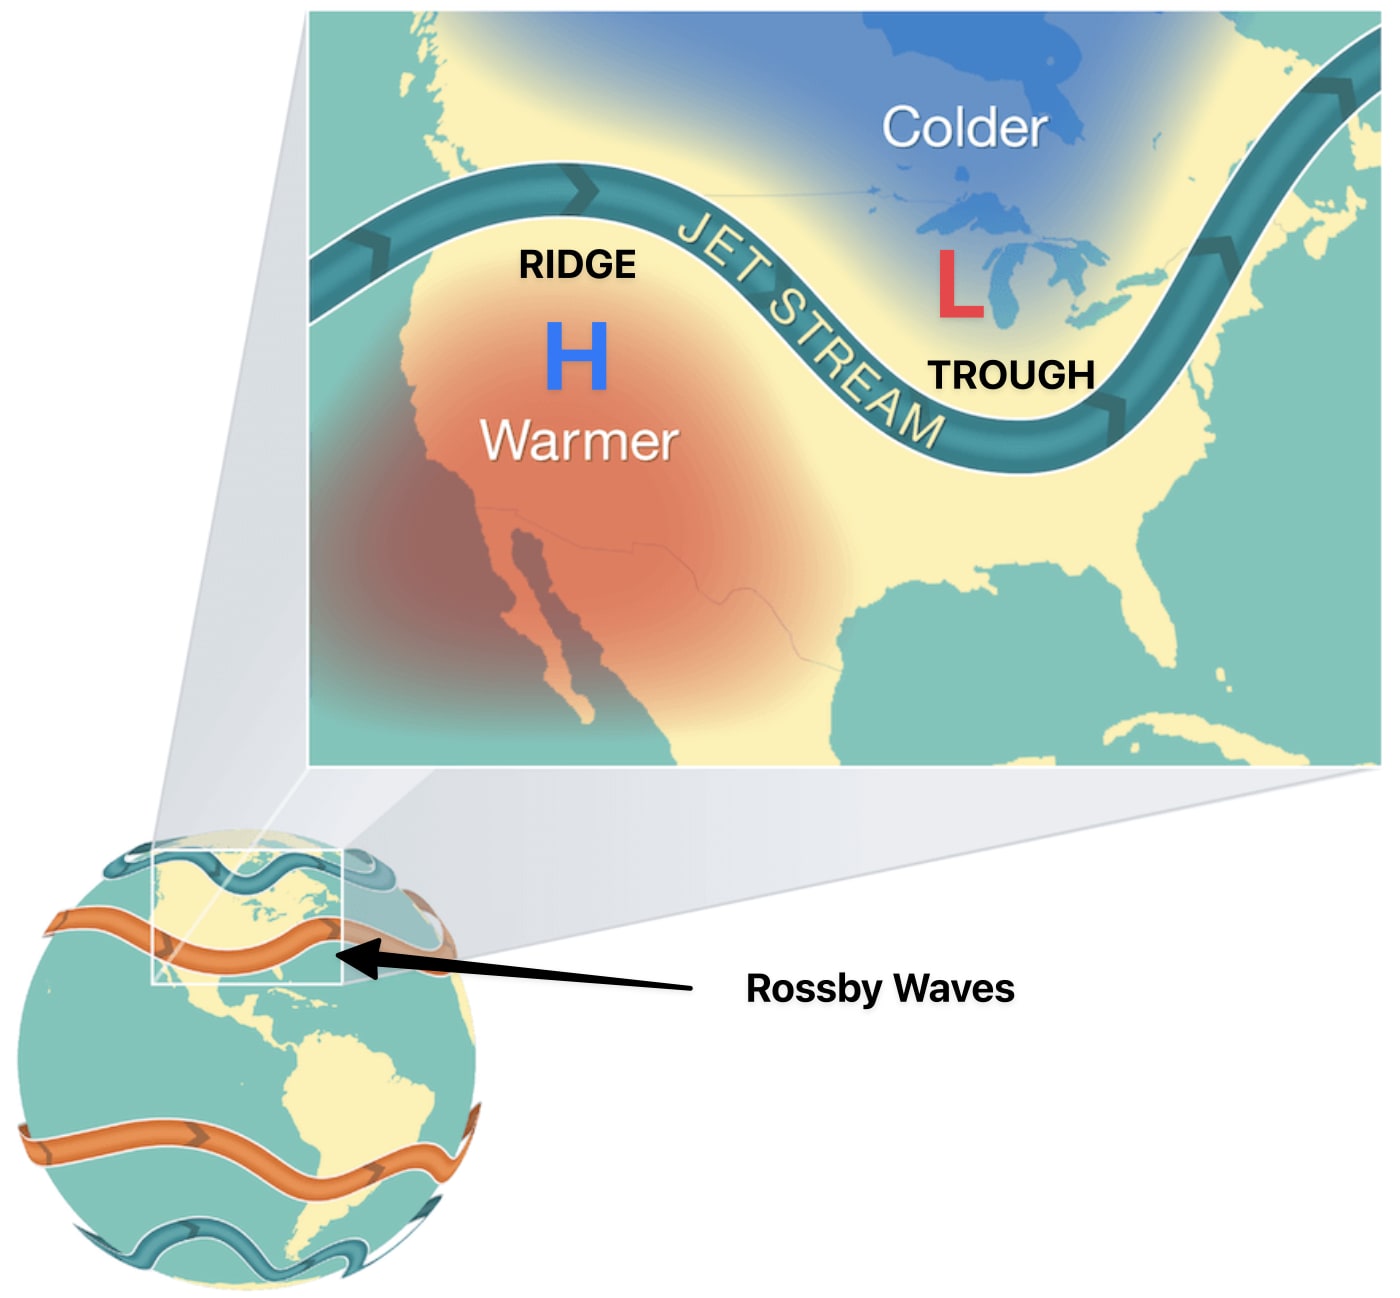
large-scale meandering of high-altitude windsAs a result of temperature & pressure differences and the rotation of Earth, high-altitude winds no longer flow just west to east, but can take on north/south paths.
These waves are not an independent force themselves. They are simply the way we talk about the modified shape, direction, and speed of winds — as a result of other forces .
The best way to see Rossby Waves in action is to look at the flow of jet streams and notice the curvy pattern they take.
Rossby Waves are also exaggerated during El Niño & La Niña events.
Sometimes, Rossby Waves can get a little out of hand and cause disruption to the Polar Vortex.
Breaking of the Polar Vortex
Certain atmospheric conditions can disrupt the Polar Vortex’s normally stable state.
Rossby Waves can get big enough to cause the Polar Vortex to wobble or even stop and change directions.
This is called a Sudden Stratospheric Warming (SSW) event.
Sudden Stratospheric Warming
A Sudden Stratospheric Warming (SSW) event happens when there is a disruption in the normally strong Polar Vortex.
During an SSW event, the speed of the vortex can slow significantly, split, or even reverse completely!
When this happens, stratospheric air from above the Polar Vortex is drawn down to the lower part of the stratosphere.
As it sinks, higher air pressure in lower elevation causes the air to compress, which in turn causes it to warm.
Temperatures near the pole can increase by as much as 25-50ºC!
With a slow or weak Polar Vortex, frigid air is now able to leak away from the pole. This can bring episodes of extreme cold weather to mid-latitude regions .
Major SSW events usually only happen once or twice a year, and are more common during winter. They typically last only a few days to a week, but they can have a major impact on our winters.
The biggest challenge with these SSW events is that we can see them coming, but we don’t know where the cold air will end up.
Analyzing the Polar Vortex
A great way to predict disturbances to the Polar Vortex is to look at charts that forecast temperatures and zonal (west to east) wind speeds in the Stratosphere.
Seeing winds slow down and temperatures rise is a good indication that a SSW may be in the near future.
The most popular charts for this are the Temperature and Zonal Winds for 60° (latitude, near the poles) at 10hPA (pressure) height.
How to read the charts:
Red: Measured wind speed
Green: Ensemble member forecasts
Yellow: Seasonal Mean (avg)
Blue dashed: 0 m/s (i.e. no wind)
Zonal Wind
Zonal Wind measures the speed of Polar Vortex wind moving west to east.
- Positive values represent stronger west->east wind.
- Negative values represent (anomaly) east->west winds.
- Zero represents no wind speed.
See Zonal Wind chart from 2023/2024 below.
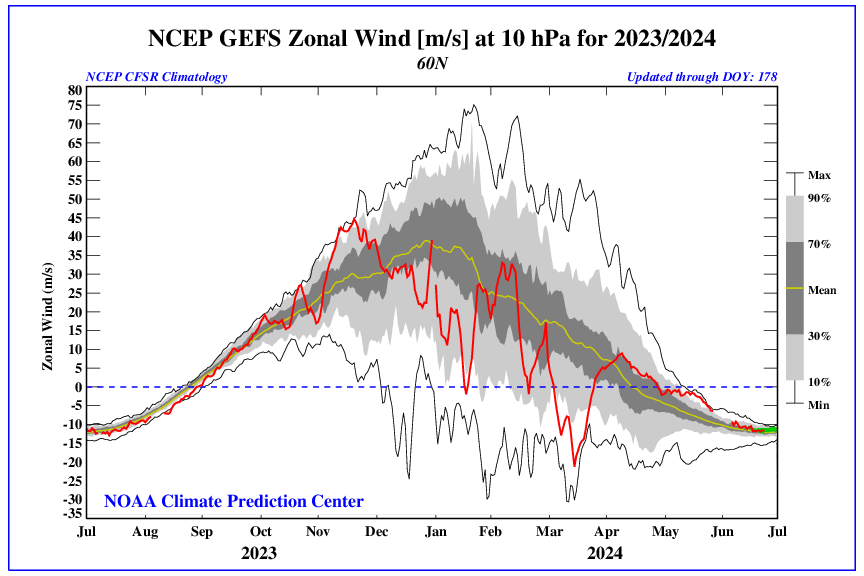
You can see some seasonality in this visual. Wind speeds start picking up in the fall, peak around mid-winter, dip back down during spring, and are generally low in the summer.
Temperature
When the Polar Vortex is strong and stable, so goes the seasonal temperature. During an SSW, temperatures will dramatically increase.
See Temperature chart from 2023/2024 below.
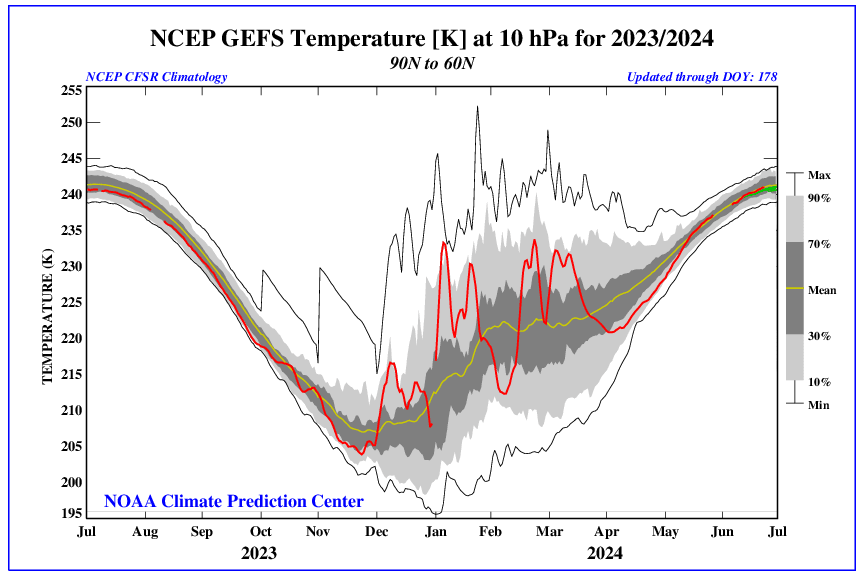
You can see seasonality in the polar temperatures as well: warm during summer months and cold during winter months. Which makes perfect sense.
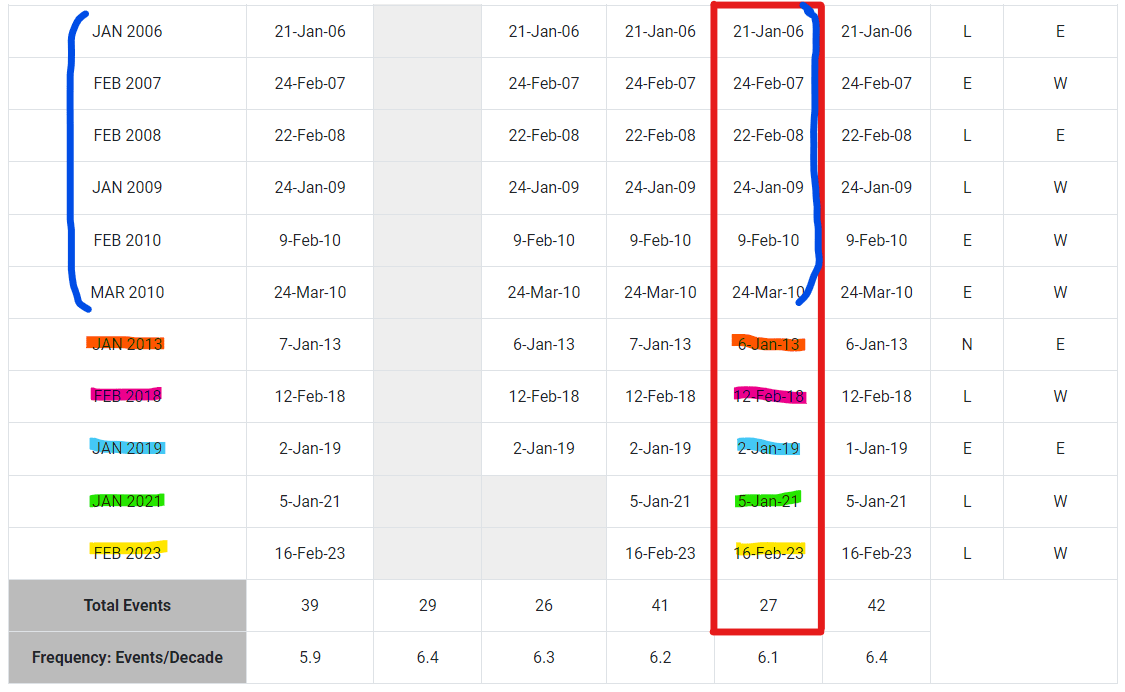
You can find other SSW events by looking at historical Zonal Wind or Temperature observations and finding correlations.
Check out these January and February charts dating back to ~1980.
Don’t worry, I’ve color coded them for easy reference.
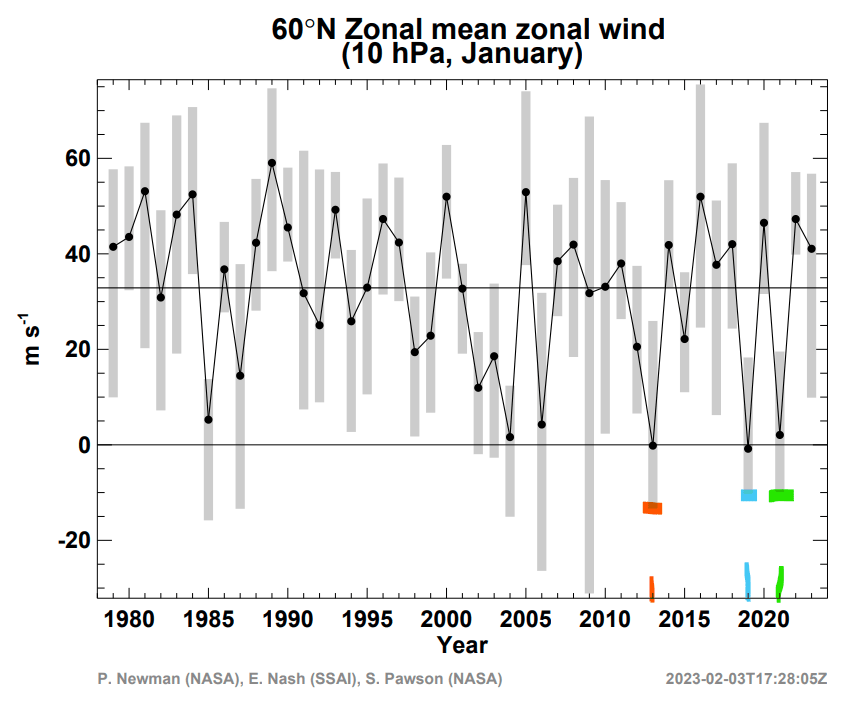
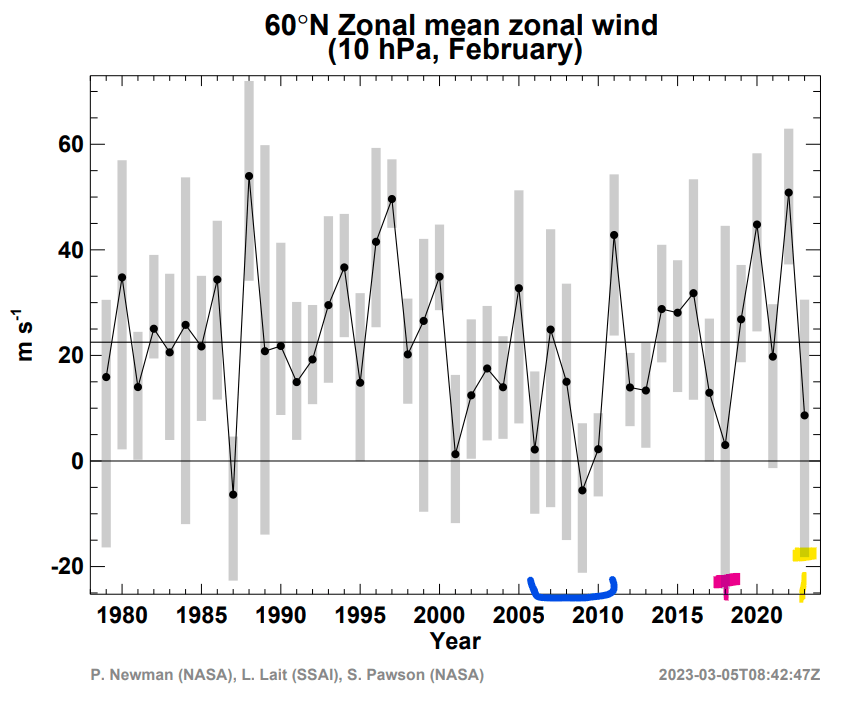
Now let’s check and see if we’re right. The table below includes documented historical SSW events.
You can see the 1:1 correlation between the documented above and below. I’ve color coded to help match the dates.
Forecasting SSW Events
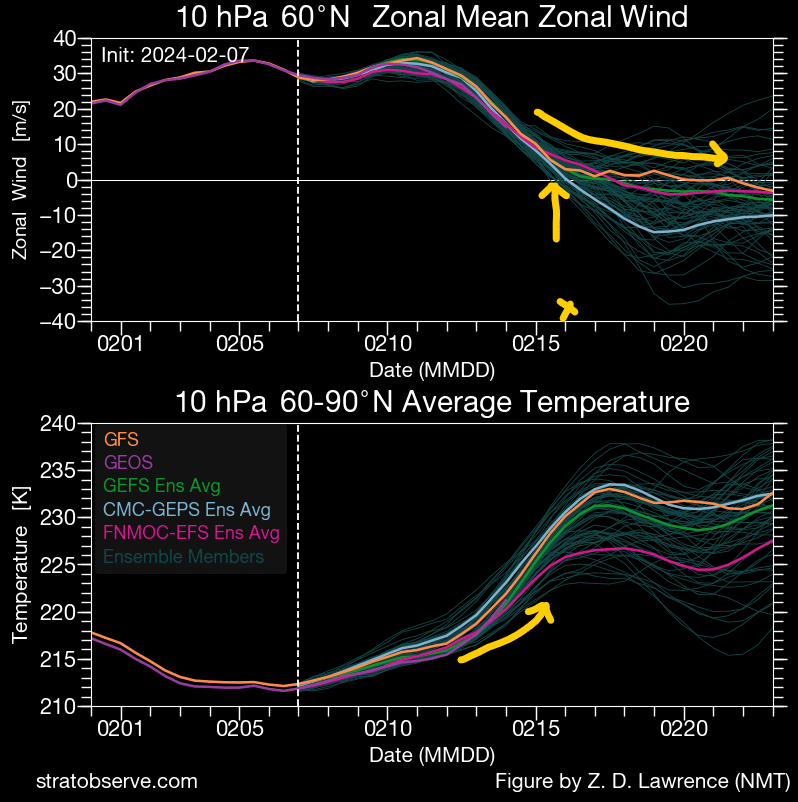
As mentioned before, we can forecast Polar Vortex events by looking at the Zonal Wind and Temperature plots for ~60° latitude @ 10hPa elevation.
Thankfully, most of the major models (ECMWF, GFS, etc) and Ensembles (GEFS, CMC-GEPS) have parameters for these.
There’s also a really cool site called StratObserve which has organized helpful plots…including a spaghetti plot of various models/ensembles which help you gauge uncertainty.
Of course, like any weather model, these are just a prediction.
Even if a SSW event does occur, knowing whether/not, where, how much cold air might impact a region is still difficult to predict.
Resources
If you’re interested in monitoring the Polar Vortex to get a bit of an edge on what our winter weather might look like, I’d recommend looking at the following resources. Remember, when the Polar Vortex is strong (positive measured winds), cold air is held tight to the Arctic. However, when the Polar Vortex weakens, winds will drop near zero (or negative) and this likely will have a strong correlation to a multi-day plummet in temps across the Northern Hemisphere.
StratObserve – Time Series There are some other great visualizations on this site.
GFS 16 Day Forecast – SSW Monitoring Here you can find the CFS, GFS, GEFS Plots. Just make sure you’re looking at the NH (Northern Hemisphere) section, then find the 10mb column and look for rows TMP and U Wind.
NOAA Ozone Watch – Current and Historical Similar to the SSW Monitoring page above, you can find plots for 60°N 10-nPa. You can select between wind and temp on the right.
ECMWF – Zonal Wind at 10-hPa ECMWF – Mean Anomaly Temp at 10-hPa